Jewish Voting Patterns and the 2012 Elections
|
|
|
- Letitia Montgomery
- 5 years ago
- Views:
Transcription

1 1 Jewish Voting Patterns and the 2012 Elections Ira M. Sheskin, Ph.D. Director of the Jewish Demography Project of the Sue and Leonard Miller Center for Contemporary Judaic Studies and Professor, Department of Geography and Regional Studies University of Miami
2 2 ) ) ) ) ) ) ) Jewish Data Sources Random Digit Dialing (RDD) Telephone Surveys (305) Random sample with NO sampling by Distinctive Jewish Name or from Jewish mailing lists Population estimate ) ) ) NJPS: The National Jewish Population Survey Local Studies: More than 55 local Jewish community studies completed since 1993 Workmen s Circle 2012 American Jews Political Values Survey (not random, although weighted to reflect NJPS ) (N = 1,000 via Internet, volunteers) It is this methodology that means that the data presented herein probably reflect reality better than such sources as exit polls and AJC (panel) surveys All local reports are available from (The Berman North American Jewish Data Bank) An earlier version of this slide set is the current featured publication at (Berman Jewish Policy Archive)
3 Outline of Presentation Implications of the Size and Geographic Distribution of the US Jewish Population for the Jewish Vote A Few Key Demographic Indicators Political Party Political Views Voter Registration Politically Active Obama, Romney and The Jewish Vote
4 4 Size and Geographic Distribution of the US Jewish Population
5 5 Varying Estimates of the US Jewish Population Does the Number of Jews Matter? )! 5,200,000 is 1.7% of 314,556,948 Americans )!! ) NJPS and ARIS 2001 estimate 6,700,000 is 2.1% of 314,556,948 Americans Sheskin and Dashefsky in the American Jewish Year Book Steinhardt Institute at Brandeis So, the strength of the community is not based upon the percentage of Americans who are Jewish, but rather upon the ability of a small minority of activist Jews to convince American opinion makers and the US government ) Most researchers (Brandeis group do not) believe that the number of American Jews has remained relatively constant over the past decades, but that the future will almost certainly lead to a decrease

6 6 42% of Jews live in New York 77% of Jews live in NY, CA, PA, NJ, IL, MA

7 7 25% of Jews live in New York 70% of Jews live in NY, CA, FL, NJ, IL, PA
8 8
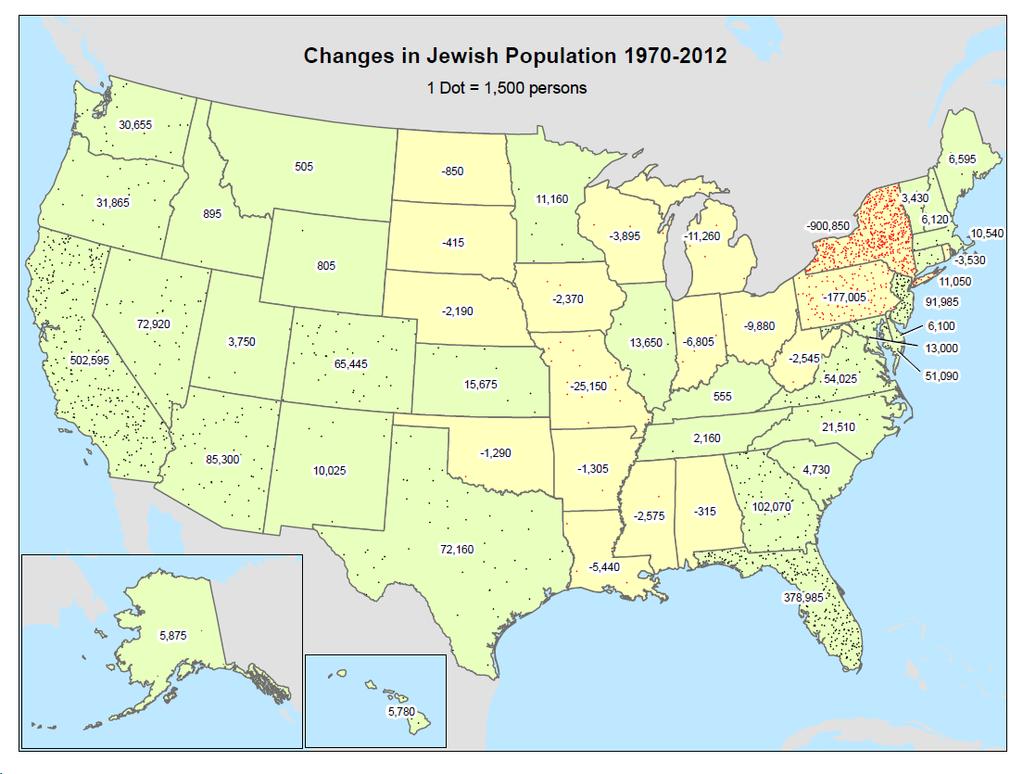
9 9 Geographic Shift in Jewish Population 100% % 80% Percentage of Jews 70% 60% 50% 40% 30% 63% 45% 21% 24% 20% 12% 12% 13% 11% 10% 0% Northeast Midwest South West Source: American Jewish Year Book
10 10 Electoral Votes by State Jews have moved to states with many electoral votes
11 11 States with the Largest Jewish Population (2012) New York California Florida New Jersey Illinois Pennsylvania Massachusetts Maryland Ohio Texas Georgia Connecticut Arizona Virginia Colorado Michigan Nevada Missouri Washington Minnesota Oregon North Carolina Wisconsin District of Columbia Tennessee Rhode Island Kansas Indiana Delaware Maine South Carolina New Mexico Kentucky Louisiana New Hampshire Alabama Hawaii Iowa Alaska Nebraska Utah Vermont Oklahoma West Virginia Arkansas Mississippi Idaho Montana Wyoming North Dakota South Dakota 127, , ,300 95,240 91,920 82,270 76,300 59,175 45,885 45,635 40,650 31,675 28,255 28,000 19,575 18,750 17,675 17,470 15,100 13,890 13,570 12,725 11,300 10,675 10,120 8,825 7,280 6,240 6,175 6,100 5,650 5,285 4,625 2,310 1,725 1,550 1,525 1,350 1, ,985 (29) 504,450 (14) 297,985 (20) 294,925 (20) 277,980 (11) 238,200 (10) 148,615(18) 139,505(38) ) ) ) ) ) 1,223,640 (55) 1,761,020(29) Top 4 states with the largest Jewish populations account for 127 electoral votes Top 10 states with the largest Jewish populations account for 244 electoral votes 270 electoral votes are needed to secure the White House Recall what a difference a few votes in Florida made in 2000 Elections are won by only a few percentage points 0 500,000 1,000,000 1,500,000 2,000,000
12 12 New York New Jersey District of Columbia Massachusetts Maryland Florida California Connecticut Nevada Illinois Pennsylvania Colorado Rhode Island Delaware Arizona Georgia Ohio Virginia Oregon Maine Missouri Alaska Minnesota Vermont Michigan New Hampshire Washington Kansas New Mexico Texas Hawaii Wisconsin Nebraska North Carolina Tennessee South Carolina Indiana Kentucky Louisiana Iowa Utah Alabama Montana West Virginia Oklahoma Idaho Arkansas North Dakota Mississippi South Dakota South Dakota States with the Highest Percentage of Its Residents Who Are Jewish (2012) 1.8% 1.8% 1.7% 1.6% 1.3% 1.3% 1.2% 1.0% 1.0% 1.0% 0.9% 0.9% 0.8% 0.8% 0.8% 0.7% 0.6% 0.6% 0.5% 0.5% 0.5% 0.3% 0.3% 0.3% 0.3% 0.3% 0.3% 0.2% 0.2% 0.2% 0.2% 0.1% 0.1% 0.1% 0.1% 0.1% 0.1% 0.1% 0.0% 0.0% 2.3% 2.3% 3.4% 3.2% 3.2% 2.8% ) ) ) 4.5% 4.2% 4.1% 0.0% 2.0% 4.0% 6.0% 8.0% 10.0% 5.7% The percentage of Jewish voters is much higher: Jews are a higher percentage of 18+ population Jews register to vote at a much higher percentage than other Americans Jews vote at a much higher percentage than other Americans 9.0%

13 13 As of October 11, 2012
14 14 The Nine Swing States Electoral Votes Jewish Population % Jewish Arab Population b Florida ,985 a 3.4% 103,611 Pennsylvania , % 64,893 Ohio , % 67,373 Virginia 13 95, % 61,222 Wisconsin 10 28, % 11,781 Colorado 9 91, % 17,119 Iowa 6 6, % 6,426 Nevada 5 76, % 10,982 New Hampshire 4 10, % 7,009 Mitchell Bard, in The Arab Lobby makes the point that Arabs are not a monolithic group, that the Arab lobby is a top down lobby, and that the Arab public has really not entered the political arena on the Israel issue in a significant way. a Excludes 77,700 part-year residents b Source: US Census 2010
15 15 Jewish Senators 112th Congress Name Party State Richard Blumenthal Dem Connecticut Barbara Boxer Dem California Ben Cardin Dem Maryland Dianne Feinstein Dem California Al Franken Dem Minnesota Herb Kohl Dem Wisconsin Frank Lautenberg Dem New Jersey Carl Levin Dem Michigan Joseph Lieberman Ind Connecticut Bernie Sanders Ind Vermont Charles Schumer Dem New York Ron Wyden Dem Oregon Total of 12 senators representing 10 states
16 16 Jewish Representatives 2012 Gabrielle Giffords (AZ) and Anthony Weiner (NY) Name State Name State Gary Ackerman New York Sander Levin Michigan Shelley Berkley Nevada Nita Lowey New York Howard Berman California Jerry Nadler New York Eric Cantor * Virginia Jared Polis Colorado David Cicilline Rhode Island Steven Rothman New Jersey Steve Cohen Tennessee Jan Schakowsky Illinois Susan Davis California Adam Schiff California Ted Deutsch Florida Allyson Schwartz Pennsylvania Eliot Engel New York Brad Sherman California Bob Filner California Debbie Wasserman-Schultz Florida Barney Frank Massachusetts Henry Waxman California Steve Israel New York John Yarmuth Kentucky * Republican Total of 24 representing 20 states
17 17 Jews in Congress 2012 (112th) 12 Senators 24 Representatives 6D D 2D D D Minnesota elects first Muslim to the House D D D D Michigan has 150,000 Arab American voters D D D I D D 5D D I,D D D DD D R 2D Jews get elected from states in which Jews are a tiny percentage of the population Senate Seats in Red House Seats in Black D = Democratic R = Republican I = Independent
18 18 Largest American Jewish Communities (Number of Jews in Jewish Federation Service Areas) New York 1,538,000 South Florida Los Angeles 555, ,200 Chicago San Francisco Washington Philadelphia Boston Broward South Palm Beach West Palm Beach Atlanta Miami East Bay Baltimore Rockland County San Diego Bergen County Essex-Morris Denver Phoenix Cleveland Las Vegas Monmouth County Detroit 291, , , , , , , , , , ,000 93,400 91,100 89,000 92,500 91,000 83,900 82,900 80,800 72,300 70,000 67,000 Source: 2012 American Jewish Year Book 0 500,000 1,000,000 1,500,000
19 19 ) ) ) ) ) ) Conclusions - Demography While there is no agreement on the number of Jews in the US, nor whether that number is increasing or decreasing, it probably matters little in the ability of American Jews to have their say in the political system With most elections being decided by 1-5 percentage points, even a small minority can influence an election, particularly in States with somewhat larger percentages of Jews While the Jewish population has undergone a major geographic shift from the Northeast and Midwest to the South and the West, electoral votes have done the same Jews continue to concentrate in the most populous states with the most electoral votes Jews get elected to Congress even from states with very few Jews Jews do form a significant percentage of the population in some urban areas
20 20 A Few Key Demographic Indicators
21 Age Distribution-All Americans, 2010 Median Age is 37 Years 13% are Age 65 and Over 6% are Age 75 and Over Age Group Males Females 0.2% 0.4% 0.4% 0.8% 0.7% 1.1% 1.0% 1.3% 1.4% 1.6% 1.9% 2.1% 2.6% 2.8% 3.1% 3.3% 3.5% 3.7% 3.6% 3.7% 3.4% 3.4% 3.3% 3.3% 3.2% 3.2% 3.4% 3.4% 3.6% 3.4% 3.7% 3.5% 3.4% 3.3% 3.4% 3.2% 3.3% 3.2% 10.0% 8.0% 6.0% 4.0% 2.0% 0.0% 2.0% 4.0% 6.0% 8.0% 10.0%
22 Age Distribution-Persons in Jewish Households, 2000 Median Age is 39 Years 16% are Age 65 and Over 8% are Age 75 and Over Age Group Males 0.1% 0.3% 0.5% 0.6% 1.1% 1.6% 1.8% 1.9% 1.8% 2.3% 2.0% 2.2% 1.7% 2.0% 2.5% 2.9% 4.1% 4.2% 4.0% 4.1% 3.4% 3.8% 3.4% 3.0% 3.3% 3.5% 3.6% 3.2% 4.4% 4.2% 2.9% 3.2% 3.0% 2.6% 2.9% 2.5% 2.8% 3.0% Females 10.0% 8.0% 6.0% 4.0% 2.0% 0.0% 2.0% 4.0% 6.0% 8.0% 10.0%
23 23 South Palm Beach West Palm Beach Sarasota Martin-St. Lucie Palm Springs Broward Middlesex Atlantic County Miami St. Petersburg New Haven Las Vegas San Antonio Detroit Lehigh Valley Rhode Island Tucson Hartford Jacksonville Phoenix Rochester Milwaukee Baltimore Cincinnati Los Angeles Monmouth Chicago Minneapolis New York Pittsburgh Bergen Philadelphia Portland (ME) St. Paul York St. Louis Howard County San Diego Essex-Morris Wilmington Westport Harrisburg Richmond Denver Boston San Francisco Tidewater Orlando Atlanta Washington Columbus Seattle Charlotte NJPS 2000 US 2010 Age 65 and Over (Persons in Jewish Households) 36% 34% 30% 28% 27% 26% 24% 24% 23% 23% 23% 23% 20% 20% 20% 20% 19% 19% 19% 19% 18% 18% 18% 18% 18% 17% 16% 16% 16% 16% 15% 15% 15% 15% 14% 13% 13% 12% 12% 12% 12% 12% 11% 10% 9% 9% 9% 16% 13% 48% 48% 46% 57% 53% 0% 20% 40% 60% 80% 100% 62% Increasing percentage elderly as baby boomers retire Large percentage elderly in many Jewish communities Political Implication: Voting for Candidates perceived as being more in favor of benefits for the elderly
24 24 Westport Washington Howard County Portland (ME) Columbus New Haven Bergen Atlanta Cincinnati Essex-Morris San Antonio Denver Chicago San Diego Charlotte Philadelphia Lehigh Valley Pittsburgh Minneapolis Hartford St. Paul Rochester Tucson Rhode Island Phoenix Milwaukee Middlesex Richmond New York St. Louis Baltimore Detroit Harrisburg Jacksonville Wilmington York Miami Atlantic County Tidewater Sarasota Monmouth West Palm Beach Orlando St. Petersburg Las Vegas South Palm Beach Martin-St. Lucie Broward 4-Year College Degree or Higher (Adults Age 25 and Over in Jewish Households) 35% 63% 63% 61% 60% 60% 60% 59% 59% 58% 58% 55% 53% 49% 49% 49% 48% 86% 85% 82% 81% 79% 78% 76% 76% 75% 75% 75% 74% 73% 72% 72% 71% 71% 70% 70% 69% 69% 68% 68% 68% 67% 66% 66% 66% 65% 64% 63% Very Highly Educated Political Implication: Continued Political Involvement US % 0% 20% 40% 60% 80% 100%
25 25 Westport Bergen Essex-Morris Howard County Washington New Haven Monmouth Hartford Detroit San Antonio Atlantic County Boston San Francisco Charlotte Middlesex Portland (ME) Lehigh Valley Atlanta Jacksonville Cincinnati Minneapolis Richmond Phoenix Rochester St. Paul Pittsburgh Tidewater Wilmington Sarasota Milwaukee Harrisburg Chicago Rhode Island Seattle Philadelphia West Palm Beach Palm Springs Columbus Denver Baltimore Miami San Diego St. Louis York Buffalo New York Los Angeles Orlando Las Vegas Tucson South Palm Beach Martin-St. Lucie St. Petersburg Broward NJPS 2000 ACS 2009 Median Household Income (Adjusted for inflation to 2009 dollars) (Jewish Households) $50 $55 $104 $104 $102 $97 $96 $96 $94 $94 $94 $93 $93 $92 $92 $92 $89 $89 $88 $87 $87 $86 $85 $85 $83 $82 $82 $82 $81 $81 $81 $80 $80 $80 $78 $77 $76 $75 $75 $75 $74 $74 $73 $71 $70 $69 $68 $67 $63 $62 $64 $122 $119 $114 $130 $170 High Income Group Political Implication: If Vote their interests, more Jews will vote Republican (But historically Jews have pockets like Episcopalians, but vote like Puerto Ricans ) $0 $20 $40 $60 $80 $100 $120 $140 $160 $180 (in thousands)
26 26 Jewish Identification (Jewish Respondents) National Jewish Population Survey Conservative 25% Reconstructionist 2% Orthodox 8% Reform 35% Just Jewish 30%
27 27 Baltimore New York Bergen Detroit Atlanta Cleveland Harrisburg Miami Monmouth Middlesex Pittsburgh Philadelphia Rhode Island Rochester Palm Springs Los Angeles Buffalo Wilmington Cincinnati Columbus Seattle New Haven Lehigh Valley San Antonio South Palm Beach Hartford Broward Richmond Las Vegas San Francisco San Diego Phoenix Tidewater Essex-Morris Milwaukee St. Louis St. Petersburg Denver Portland (ME) West Palm Beach Minneapolis St. Paul Washington Jacksonville Tucson Sarasota Westport Howard County Charlotte Orlando Atlantic County Martin-St. Lucie York NJPS 2000 Orthodox Identification (Jewish Respondents) 21% 20% 12% 11% 10% 10% 10% 9% 9% 7% 7% 6% 6% 6% 6% 6% 6% 6% 5% 5% 5% 4% 4% 4% 4% 4% 4% 4% 3% 3% 3% 3% 3% 3% 3% 3% 3% 2% 2% 2% 2% 2% 2% 2% 2% 2% 2% 2% 2% 2% 1% 1% 1% 8% Low Percentage Orthodox which has not increased (although participation in orthodox Institutions is on the Rise) Political Implication: Although more likely to vote Republican, not a big percentage of American Jews 0% 20% 40% 60% 80% 100%
28 28 Intermarriage (Couples Intermarriage Rate) Portland (ME) Seattle San Francisco Denver Atlanta Las Vegas Charlotte York Tucson Boston Columbus San Diego Jacksonville Tidewater Washington Phoenix St. Paul San Antonio Pittsburgh Lehigh Valley Cincinnati Richmond Rhode Island New Haven Harrisburg Chicago Minneapolis Wilmington Westport Orlando Rochester Howard County St. Petersburg Milwaukee Philadelphia Martin-St. Lucie Atlantic County Buffalo St. Louis Hartford Los Angeles Cleveland New York Baltimore Sarasota Palm Springs Broward Bergen Monmouth Miami Detroit West Palm Beach Middlesex South Palm Beach 9% 55% 55% 53% 50% 48% 47% 46% 46% 46% 45% 44% 44% 43% 41% 40% 39% 37% 36% 36% 34% 34% 34% 34% 33% 33% 33% 33% 33% 32% 30% 29% 29% 28% 28% 27% 26% 26% 25% 23% 23% 23% 22% 20% 20% 19% 18% 17% 17% 16% 16% 16% 14% 61% High Rates of Intermarriage Political Implication: Although not good for Jewish continuity, at least temporarily Jews living with non-jews impact the political thinking of non-jews. Jews Live in an increasing number of households NJPS % 0% 20% 40% 60% 80% 100%
29 29 St. Louis St. Paul Rochester Detroit Sarasota Milwaukee Bergen Lehigh Valley San Antonio Pittsburgh Tidewater Hartford Monmouth Minneapolis York Richmond Wilmington Harrisburg Baltimore Middlesex Jacksonville West Palm Beach Atlantic County Charlotte South Palm Beach Miami New Haven Rhode Island Westport Martin-St. Lucie Broward Howard County New York St. Petersburg Chicago Washington Tucson Portland (ME) Los Angeles Orlando Atlanta San Francisco Seattle Las Vegas Association with the Jewish Community NJPS 2000 (Belong to a Synagogue, JCC, or Other Jewish Organization) (Jewish Households) 69% 67% 65% 64% 64% 64% 63% 62% 62% 62% 62% 62% 62% 60% 60% 60% 59% 59% 58% 58% 58% 57% 57% 57% 54% 54% 53% 52% 52% 50% 21% 31% 37% 50% 49% 49% 49% 48% 48% 48% 46% 46% 46% 42% 0% 20% 40% 60% 80% 100% 51% Low Levels of Membership in Jewish Institutions Political Implication: Less Likely to follow the guidance of Jewish communal leaders in political affairs
30 30 ) ) ) ) ) ) Conclusions - Demographic Indicators American Jews are aging American Jews are well educated American Jews are of high income Only a small percentage of American Jews are Orthodox American Jews are highly intermarried Large percentages of American Jews are not formally part of the community
31 31 Political Party
32 32 Political Party National Jewish Population Survey (Jewish by Religion Respondents) Democrat US: 31% 61% 14% 6% US: 29% Republican 20% Something Else US: 2% Independent US: 38%
33 33 Political Party Identification National Jewish Population Survey Democrat 61% Independent 35% 34% Democrat Independent 20% 6% 14% Republican Something Else Data are for the more Jewishly-connected sample of 4.3 million Jews. 15% Something Else 16% Data are for the less Jewishly-connected sample of 900,000 Jews. Republican
34 34 Percentage Democrat Washington 69% Los Angeles 69% Minneapolis 66% St. Paul 63% Bergen 63% Columbus 58% Seattle 53% NJPS % 0% 20% 40% 60% 80% 100%
35 35 Percentage Republican Columbus 15% St. Paul 13% Washington 11% Los Angeles 11% Bergen 11% Minneapolis 9% Seattle 7% NJPS % 0% 20% 40% 60% 80% 100%
36 36 Political Party Washington 2003 (Jewish Respondents) Democrat 69% 11% Republican 17% 4% Something Else Independent
37 37 100% Political Party by Age NJPS Democrat Republican Independent 80% 73% 64% 60% 56% 59% 58% 40% 20% 18% 19% 15% 16% 15% 23% 22% 12% 9% 16% 0% Under Something Else Not Shown See also: Steven Windmueller (December 2003) Are American Jews Becoming Republican? Insights into Jewish Political Behavior (Jerusalem Center for Public Affairs)
38 38 100% Political Party by Age Washington 2003 Democrat Republican Independent 80% 75% 69% 69% 69% 64% 60% 40% 20% 9% 17% 13% 13% 10% 20% 20% 13% 6% 17% 0% Under Something Else Not Shown
39 39 100% Political Party by Age Bergen 2001 Democrat Republican Independent 80% 65% 63% 69% 70% 60% Orthodox 45% 40% 22% 25% 22% 22% 20% 17% 14% 14% 10% 6% 4% 0% Under Something Else Not Shown
40 40 Democrat Washington 2003 All 69% Male 60% Female 77% Household with Children 71% Federal Gov't Employees 72% Income under $25,000 $25-$50,000 $50-$100,000 $100-$200,000 $200, % 66% 69% 71% 70% 0% 20% 40% 60% 80% 100%
41 41 Democrat Washington 2003 All Orthodox Conservative Reconstructionist Reform Just Jewish 56% 69% 73% 79% 71% 65% In-married Conversionary Intermarried 62% 71% 79% Synagogue Member Non-Member 73% 67% JCC Member Non-Member Jewish Organization Member Non-Member 69% 68% 77% 76% Federation Non-Donor Donated under $100 Donated $ % 67% 78% 0% 20% 40% 60% 80% 100%
42 42 Republican Washington 2003 All 11% Male Female 8% 14% Household with Children 13% Federal Gov't Employees 9% Income under $25,000 $25-$50,000 $50-$100,000 $100-$200,000 4% 7% 9% 13% The relationship that many expect between income and party does not hold for Democrats, but does show up for Republicans $200, % 0% 20% 40% 60% 80% 100%
43 43 Republican Washington 2003 All Orthodox Conservative Reconstructionist Reform Just Jewish 11% 9% 6% 12% 9% 28% In-married Conversionary Intermarried 9% 8% 15% Synagogue Member Non-Member JCC Member Non-Member Jewish Organization Member Non-Member 9% 11% 8% 11% 8% 11% Federation Non-Donor Donated under $100 Donated $ % 12% 10% 0% 20% 40% 60% 80% 100%
44 44 Political Party Workmen s Circle May 2012 US: 29% Republican US: 31% Democrat 55% 22% 23% Independent/Other US: 40%
45 Jewish Vote for the Republican Candidate in Presidential Elections % 80% 60% 10% 10% 10% 10% 18% 15% 18% 17% 15% 15% 17% 21% 27% 23% 28% 36% 32% 33% 31% 32% 45% 43% 40% 37% McGovern 40% 20% 0% 1920 Harding 1916 Hughes 1932 Hoover 1928 Hoover 1924 Coolidge 1940 Wilkie 1936 Landon 1948 Dewey 1944 Dewey 1960 Nixon 1956 Eisenhower 1952 Eisenhower 1976 Ford 1972 Nixon 1968 Nixon 1964 Goldwater 1988 Bush 1984 Reagan 1980 Reagan 1996 Dole 1992 Bush 2004 Bush 2000 Bush 2008 McCain 45 Since 1916, average for Democrat is 71% Clinton Clinton Gore Kerry Obama Carter Carter Mondale Dukakis Bush I lonely man against powerful political forces Source through 1968: L. Sandy Maisel and Ira Forman, Eds. Jews in American Politics (Lanham: Rowman & Littlefield, 2001). Source 1972 to 2008: The Solomon Project at and
46 Jewish Vote for the Republican Candidate in Presidential Elections % 80% McGovern Carter 15% 15% 17% 21% 23% 32% 33% 31% 32% 37% 60% 40% 20% Bush I lonely man against powerful political forces 0% 1972 Nixon 1976 Ford 1980 Reagan 1984 Reagan 1988 Bush 2000 Bush 1996 Dole 1992 Bush 2004 Bush 2008 McCain average: 33% Clinton Clinton Gore Kerry Carter Mondale Dukakis Obama 74% average: 18% Source: The Solomon Project at and
47 47 Why Do Jews Remain Democrats in Such Overwhelming Numbers? Because they are Jews and are reluctant to change philosophy Social Issues (government should get out of morality issues) Minority status Belief in helping the needy Diplomacy is better than military strength 6. Jews have not yet seen a presidential candidate on the Democratic side who is viewed as sufficiently negative on Israel
48 48 What Role Does Israel Play in The Jewish Vote? 1. Israel in 2008 was 8th out of 15 issues in terms of importance as an issue in candidate choice Above Israel: health care, gas prices, energy, taxes, education Below Israel: appointments to Supreme Court and the Environment 4. When asked to name the top three issues, 15% chose Israel among the top three (mostly Orthodox Jews) The more one cared about Israel, the more likely one was to vote for McCain At every level of concern for Israel, Jews intention to vote for Obama exceeded those of comparable non-jews 7. Source: AJC Survey 2008
49 Factors Influencing Voting Workmen s Circle Survey, April 2012 Social Justice Commitment (abortion, environment, same-sex marriage, and health insurance) Economic Justice Commitment (views on taxes being unfair, raising taxes on the affluent, threat of banks, siding with labor unions, and the need for government to help the poor) Economic Conservatism (concern for high taxes, business climate, and jobs) 1 and 2 vote for Obama, 3 for Romney Notice that Israel is not on this list Standardized regression coefficients predicting vote 1. Party ID (.38) 2. Social Issues (.27) 3. Economic Justice (.21) 4. Economic issues (jobs, taxes, etc.) (.12) 5. Israel attachment (.07) Source: Workmen s Circle 2012 American Jews Political Values Survey
50 50 Conclusions - Political Party ) ) ) ) ) More than 60% of Jews continue to identify as Democratic and only 14% as Republican Evidence shows a tendency away from Democratic and toward Independent, but not Republican, among younger Jews Females are more likely to identify as Democratic than are males Orthodox Jews are less likely to be Democratic and more likely to be Republican Since 1916, the percentage of Jews voting for the Republican candidate for President has varied from 10% to 45%. While in recent years, the percentage has been increasing, the percentage has been much higher at various times in the past
51 51 Political Views
52 52 Political View National Jewish Population Survey (Jewish Respondents) Liberal 56% 21% 22% Conservative Moderate
53 53 Political Views Moderate Moderate 21% 56% Liberal 23% 54% Liberal 22% 23% Conservative Conservative Data are for the more Jewishly-connected sample of 4.3 million Jews. Data are for the less Jewishly-connected sample of 900,000 Jews.
54 54 Political View Washington 2003 (Jewish Respondents) Liberal 52% 11% 37% Conservative Moderate
55 55 100% Political View by Age Washington 2003 Liberal Moderate Conservative 80% 60% 53% 51% 50% 54% 60% 40% 36% 38% 40% 34% 23% 20% 11% 11% 10% 13% 17% 0% Under
56 56 Political Party and Political View NJPS Liberal Democrat 41% Conserv. Republican 9% Moderate Republican 3% Liberal Republican 2% Conserv. Independent 5% Moderate Independent 7% Moderate Democrat 9% Other 7% Conservative Democrat 7% Liberal Independent 10%
57 57 ) ) ) Conclusions - Political Views 56% of Jews identify as liberal, 21% moderate, and 22% Conservative Orthodox Jews are less likely to identify as liberal and more likely to identify as conservative Although the majority of Jews are Democratic and the majority are liberal, a minority, although a significant minority, identifies as both liberal and Democratic
58 58 Registered to Vote
59 59 Registered to Vote South Palm Beach West Palm Beach Washington Columbus Richmond Bergen Harrisburg St. Petersburg Los Angeles Orlando 96% 96% 96% 95% 95% 92% 91% 91% 90% 90% New York 83% NJPS % U.S % 0% 20% 40% 60% 80% 100%
60 60 Registered to Vote Under 35 West Palm Beach Washington Richmond Miami Orlando South Palm Beach Harrisburg Bergen St. Petersburg Los Angeles 94% 94% 91% 85% 84% 83% 83% 82% 81% 80% NJPS % 0% 20% 40% 60% 80% 100%
61 61 100% Registered to Vote by Age National Jewish Population Survey % 93% 90% 96% 80% 80% 60% 40% 20% 0% Under
62 62 Jews Turnout to Vote at a High Rate Estimated Turnout in 2008 American National Election Study Jews 96% Religious 87% Blacks 79% Union Household 79% Non-Jewish Whites 76% High Income Non-Jewish Whites 79% Low Income Non-Jewish Whites 63% 0% 20% 40% 60% 80% 100% 120%
63 63 Jews Turnout to Vote at a High Rate Voting Frequency (Always + Nearly Always) American National Election Study Jews 84% Religious 82% Blacks 59% Union Household 67% Non-Jewish Whites 57% High Income Non-Jewish Whites 64% Low Income Non-Jewish Whites 45% 0% 20% 40% 60% 80% 100%
64 64 The number of actual Hispanic voters is about 9 million compared to perhaps as many as 5 million Jewish voters (Hispanics are 16% of the population, Jews are 2%) Source: New York Times, June 9, 2012
65 65 Politically Active Attended Political Meetings or Rallies Contributed Money to a Political Party or Candidate Contacted or Wrote a Government Official in the Past Year
66 66 100% Participate in Political Activities by Age National Jewish Population Survey % 60% 40% 35% 34% 32% 33% 33% 25% 20% 0% Under All
67 67 Contributions to Israeli and Arab PACs Pro-Israel All Contributions Pro-Israel PACS Pro-Arab PACS 2010 $12,784,571 $2,963,418 $39, $13,991,522 $3,150,927 $32, $10,970,817 $3,033,993 $96, $11,124,734 $3,170,494 $151, $8,774,900 $2,750,601 $114, $7,029,216 $1,923,904 $154, $6,010,998 $2,104,331 $106, $5,575,881 $2,387,880 $87, $5,915,688 $2,378,059 $22, $8,748,303 $4,048,960 $31, $7,994,040 $4,099,248 $2,000
68 68 ) ) ) Conclusions - Political Involvement The vast majority of American Jews are registered to vote The percentage registered to vote is lower for Jews under age 35 Nationally, about one third of Jews are politically active, but again the percentage is lower for those under age 35

69 69 Obama Policies: Impact on Jewish Vote?
70 Obama s Initial Policies Toward Israel Mostly a failure No breakthrough with Arabs/Muslims despite Cairo speech Settlement freeze demand on Israeli government backfires Alienated both Arabs and Israelis Abbas refused to negotiate Never visited Israel while in office 1. 9 meetings with Netanyahu in addition to phone calls 2. Biden and Clinton have both gone 3. Did visit as a candidate in 2008 (Sderot)
71 71 Presidential Visits to Israel President Years Visits While in Office Policy Nixon June 1974 Airlift in 1973 Ford Never "reassessment of US policy" Carter March 1979 Camp David Reagan Never "major non-nato ally" but suspension of aid over bombing of Iraqi reactor, friction over Lebanon War
72 72 Presidential Visits to Israel President Years Visits While in Office Policy Bush I Never Baker says Israel should abandon expansionist policies, withholding of loan guarantees Clinton Oct 94, Nov 95, March 96, Dec 98 Camp David II Bush II Jan 08, May 08 Verbally supportive, but no progress on Palestinians or Iran Obama Not yet
73 Evidence of Obama Support for Israel Stopped calling for a settlement freeze and vetoed UN Security Council Resolution on settlements, despite the differences over settlement policy, which every US administration has had. (Obama never threatened Israel as did Bush I over the loan guarantees.) 1967 borders with agreed upon land swaps" has been US policy for decades Increased military aid and cooperation above the normal $3 billion annually. $3.1 Billion requested for FY2013 is the highest ever. Provided funds for Israel's Iron Dome defense system ($275 million over and above other aid) Ehud Barak: I can hardly remember a better period of American support and backing, and Israeli cooperation and similar strategic understanding of events around us than we have right now. Netanyahu to Congress: thank you to Obama for being very generous in giving us the tools to do the job of defending Israel on our own.
74 Evidence of Obama Support for Israel Cut off funds to UNESCO "Stopped UN recognition of Palestine. In fact, Barack Obama is the first American president under whom the UN has passed no anti-israel resolution Went to the heart of the Arab world (Cairo) and said: 1. America's strong bond with Israel are well known. This bond is unbreakable. It is based upon cultural and historical ties, and the recognition that the aspiration for a Jewish homeland is rooted in a tragic history that cannot be denied. 2. Around the world, the Jewish people were persecuted for centuries, and anti-semitism in Europe culminated in an unprecedented Holocaust. Tomorrow, I will visit Buchenwald, which was part of a network of camps where Jews were enslaved, tortured, shot and gassed to death by the Third Reich. Six million Jews were killed -- more than the entire Jewish population of Israel today. Denying that fact is baseless, it is ignorant, and it is hateful. Threatening Israel with destruction -- or repeating vile stereotypes about Jews -- is deeply wrong, and only serves to evoke in the minds of Israelis this most painful of memories while preventing the peace that the people of this region deserve.
75 Evidence of Obama Support for Israel Harder line on Iran (deployment of computer viruses in Iran) than any previous president and managed to get Russia and China to support hard sanctions, which are seriously impacting Iran Got Russia to cancel a sale of advanced antiaircraft missiles that would complicate any US or Israeli attack Obama stated that he will always have Israel's back. Stood with Israel on the unfairness of the Goldstone report on Gaza
76 76 Approve or Disapprove of the Obama Administration's Handling of US-Israel Relations? (American Jewish Committee, April 2012) Not Sure 7% 1% Not Sure 40% Disapprove Disapprove 53% Approve 40% 58% Approve September, 2011 April, 2012
77 77 Poll Results
78 78 Overall Support American Jewish Committee, April 2012 Tendency to compare the Obama percentage to the 74% in 2008 election should be resisted. Obama 61% 11% Undecided 28% Romney
79 79 Overall Support Workmen s Circle, April 2012 Obama 59% 14% 27% Undecided Romney
80 80 Overall Support - Allocating Undecided Workmen s Circle, April percentage points higher than non-jews Obama 68% 32% Romney
81 81 Overall Support Gallup June 2012 In June 2008, Obama polled 62% Latest Gallup Poll puts support for Obama at 70% July to September 10 in Florida Obama 64% 29% 7% Undecided Romney

82 82 Thank You: Ira Sheskin Any questions?

83 83 Additional Slides Changes in American Jewish Demography Political Implications Ira M. Sheskin, Ph.D. Director of the Jewish Demography Project of the Sue and Leonard Miller Center for Contemporary Judaic Studies and Associate Professor, Department of Geography University of Miami
84 Outline of Presentation Implications of the Size and Geographic Distribution of the US Jewish Population for the Jewish Vote A Few Key Demographic Indicators Political Party Political Views Voter Registration Politically Active Obama s Policies: Impact on Jewish Vote?
85 85 Political Party -Again National Jewish Population Survey (Jewish Respondents) Democrat US: 31% 61% 14% 6% US: 29% Republican 20% Something Else US: 2% Independent US: 38%
86 86 Political Party and Political View Washington 2003 Liberal Democrat 44% Conserv. Republican 5% Moderate Republican 4% Liberal Republican 1% Conserv. Independent 2% Moderate Independent 9% Liberal Independent 6% Moderate Democrat 22% Other 3% Conservative Democrat 4%
87 87 Political View Workmen s Circle May 2012 Liberal 44% 18% Moderate 38% Conservative
88 88 Political View - Again National Jewish Population Survey (Jewish Respondents) Liberal 56% 21% 22% Conservative Moderate
89 89 Politically Active Washington 2003 All 45% Male Female 43% 49% Household with Children 47% Income under $25,000 $25-$50,000 $50-$100,000 $100-$200,000 42% 42% 40% 46% $200, % 0% 20% 40% 60% 80% 100%
90 90 All Politically Active Washington % Orthodox Conservative Reconstructionist Reform Just Jewish 46% 41% 52% 47% 67% In-married Conversionary Intermarried 46% 54% 55% Synagogue Member Non-Member JCC Member Non-Member 40% 43% 46% 54% Jewish Organization Member Non-Member 42% 60% Federation Non-Donor Donated under $100 Donated $ % 49% 57% 0% 20% 40% 60% 80% 100%
91 91 Politically Active Washington 2003 All 45% Republican 43% Democrat 50% Independent 32% Liberal 51% Moderate 37% Conservative 49% 0% 20% 40% 60% 80% 100%
92 92 South Palm Beach West Palm Beach Sarasota Broward Middlesex Palm Springs Miami Martin-St. Lucie New Haven Atlantic County Detroit Rhode Island St. Petersburg Lehigh Valley San Antonio Jacksonville Phoenix Tucson Hartford Las Vegas Baltimore Cincinnati St. Paul New York Pittsburgh Rochester Chicago Philadelphia Minneapolis York Milwaukee Portland (ME) San Diego Bergen Los Angeles Monmouth St. Louis Richmond Boston Tidewater Westport Wilmington Harrisburg Denver Atlanta San Francisco Washington Essex-Morris Howard County Columbus Orlando Seattle Charlotte NJPS 2000 US % 18% 16% 16% 14% 13% 13% 12% 12% 12% 12% 12% 12% 11% 10% 10% 10% 10% 10% 10% 9% 9% 9% 9% 9% 8% 8% 8% 8% 8% 7% 7% 6% 6% 6% 6% 6% 5% 5% 5% 5% 5% 4% 4% 4% 3% 3% 8% 6% Age 75 and Over (Persons in Jewish Households) 23% 23% 32% 31% 29% 40% 0% 20% 40% 60% 80% 100%
93 93 Political Party
94 94 Political Party 100% 90% Republican Democratic Percentage of Households 80% 70% 60% 50% 40% 30% 20% 59% 14% 14% 55% 16% 62% 65% 13% 14% 60% 10% 0% Northeast Midwest South West US Data are for the more Jewishly-connected sample of 4.3 million Jews.
95 95 Political Party Minneapolis 2004 (Jewish Respondents) Democrat 66% 9% Republican 6% Something Else 19% Independent
96 96 Political Party St. Paul 2004 (Jewish Respondents) Democrat 63% 13% Republican 6% 18% Something Else Independent
97 97 Political Party Bergen 2001 (Jewish Respondents) Democrat 63% 11% Republican 19% 6% Something Else Independent
98 98 Political Party Seattle 2000 (Jewish Respondents) Democrat 53% 21% 15% 7% 3% Republican Something Else No Preference Independent
99 99 Democrat Twin Cities 2003 Twin Cities 66% Minneapolis City of Minneapolis Inner Ring Outer Ring 56% 66% 68% 74% St. Paul City of St. Paul Southern Suburbs Northern Suburbs 56% 63% 70% 68% FSU Non-FSU 57% 67% Male Female 53% 75% Household with Children 61% Income under $25,000 $25-$50,000 $50-$100,000 $100-$200,000 $200, % 70% 63% 68% 61% 0% 20% 40% 60% 80% 100%
100 100 Democrat Twin Cities Twin Cities 66% Orthodox Conservative Reform Just Jewish 30% 56% 73% 70% In-married Conversionary Intermarried 54% 56% 69% Synagogue Member Non-Member 59% 71% JCC Member Non-Member 64% 72% Federation Non-Donor Donated under $100 Donated $100-$500 Donated $ % 61% 72% 72% 0% 20% 40% 60% 80% 100%
101 101 Democrat Minneapolis Twin Cities 66% Minneapolis City of Minneapolis Inner Ring Outer Ring 56% 66% 68% 74% St. Paul City of St. Paul Southern Suburbs Northern Suburbs 56% 63% 70% 68% FSU Non-FSU 58% 68% Male Female 54% 76% Household with Children 63% Income under $25,000 $25-$50,000 $50-$100,000 $100-$200,000 $200, % 72% 64% 68% 66% 0% 20% 40% 60% 80% 100%
102 102 Democrat Minneapolis Minneapolis 66% Orthodox Conservative Reform Just Jewish Twin Cities 30% 57% 73% 71% In-married Conversionary Intermarried 54% 56% 71% Synagogue Member Non-Member 60% 72% JCC Member Non-Member 66% 72% Donated to Federation Asked, Did Not Donate Not Asked 62% 59% 72% Federation Non-Donor Donated under $100 Donated $100-$500 Donated $ % 61% 73% 79% 0% 20% 40% 60% 80% 100%
103 103 Democrat St. Paul Twin Cities 66% Minneapolis City of Minneapolis Inner Ring Outer Ring 56% 66% 68% 74% St. Paul City of St. Paul Southern Suburbs Northern Suburbs 56% 63% 70% 68% FSU Non-FSU 51% 65% Male Female 51% 73% Household with Children 57% Income under $25,000 $25-$50,000 $50-$100,000 $100-$200,000 65% 61% 67% 73% $200, % 0% 20% 40% 60% 80% 100%
104 104 Democrat St. Paul St. Paul 63% Orthodox Conservative Reform Just Jewish Twin Cities 30% 55% 71% 67% In-married Conversionary Intermarried 54% 56% 63% Synagogue Member Non-Member 58% 68% JCC Member Non-Member 57% 74% Donated to Federation Asked, Did Not Donate Not Asked 60% 66% 72% Federation Non-Donor Donated under $100 Donated $100-$500 Donated $ % 58% 62% 70% 0% 20% 40% 60% 80% 100%
105 105 Republican Twin Cities Twin Cities 10% Minneapolis City of Minneapolis Inner Ring Outer Ring 9% 6% 9% 13% St. Paul City of St. Paul Southern Suburbs Northern Suburbs 5% 5% 13% 21% FSU Non-FSU 9% 18% Male Female 7% 15% Household with Children 16% Income under $25,000 $25-$50,000 $50-$100,000 $100-$200,000 $200, % 6% 12% 10% 12% 0% 20% 40% 60% 80% 100%
106 106 Republican Twin Cities Twin Cities 10% Orthodox Conservative Reform Just Jewish 8% 7% 13% 45% In-married Conversionary Intermarried 10% 18% 16% Synagogue Member Non-Member 7% 14% JCC Member Non-Member 7% 11% Federation Non-Donor Donated under $100 Donated $100-$500 Donated $ % 9% 7% 8% 0% 20% 40% 60% 80% 100%
107 107 Republican Minneapolis Twin Cities 10% Minneapolis City of Minneapolis Inner Ring Outer Ring 9% 6% 9% 13% St. Paul City of St. Paul Southern Suburbs Northern Suburbs 5% 5% 13% 21% FSU Non-FSU 8% 16% Male 14% Female 6% Household with Children 15% Income under $25,000 $25-$50,000 $50-$100,000 $100-$200,000 $200,000+ 9% 5% 9% 11% 8% 0% 20% 40% 60% 80% 100%
108 108 Republican Minneapolis Minneapolis 9% Orthodox Conservative Reform Just Jewish 7% 7% 11% Twin Cities 45% In-married Conversionary Intermarried 9% 12% 16% Synagogue Member Non-Member 6% 13% JCC Member Non-Member 7% 9% Donated to Federation Asked, Did Not Donate Not Asked 6% 14% 12% Federation Non-Donor Donated under $100 Donated $100-$500 Donated $500+ 5% 7% 8% 13% 0% 20% 40% 60% 80% 100%
109 109 Republican St. Paul Twin Cities 10% Minneapolis City of Minneapolis Inner Ring Outer Ring 9% 6% 9% 13% St. Paul City of St. Paul Southern Suburbs Northern Suburbs 5% 5% 13% 21% FSU Non-FSU 12% 23% Male Female 10% 17% Household with Children 20% Income under $25,000 $25-$50,000 $50-$100,000 $100-$200,000 7% 9% 14% 22% $200, % 0% 20% 40% 60% 80% 100%
110 110 Republican St. Paul St. Paul 13% Orthodox Conservative Reform Just Jewish 10% 8% 18% Twin Cities 45% In-married Conversionary Intermarried 12% 16% 27% Synagogue Member Non-Member 10% 16% JCC Member Non-Member 7% 17% Donated to Federation Asked, Did Not Donate Not Asked 10% 10% 14% Federation Non-Donor Donated under $100 Donated $100-$500 Donated $500+ 7% 6% 14% 18% 0% 20% 40% 60% 80% 100%
111 % Political Party by Age Minneapolis 2003 Democrat Republican Independent 80% 80% 65% 65% 67% 60% 56% 40% 20% 17% 20% 13% 16% 22% 24% 15% 6% 5% 3% 0% Under Something Else Not Shown
112 % Political Party by Age St. Paul 2003 Republican Democrat Independent 80% 67% 67% 66% 60% 59% 54% 40% 27% 20% 8% 13% 19% 16% 17% 7% 16% 10% 20% 0% Under Something Else Not Shown
113 Political Views
114 114 Political Views 100% 90% Liberal Conservative 80% Percentage of Households 70% 60% 50% 40% 30% 53% 25% 60% 55% 22% 22% 63% 18% 56% 22% 20% 10% 0% Northeast Midwest South West US Data are for the more Jewishly-connected sample of 4.3 million Jews.
115 115 Political View Bergen 2001 (Jewish Respondents) Liberal 47% 11% 42% Conservative Moderate
116 116 Political View Seattle 2000 (Jewish Respondents) Liberal 63% 8% Conservative 29% Moderate
117 117 Political View Los Angeles 1997 (Jewish Respondents) Liberal 50% 17% 33% Conservative Moderate
118 118 Liberal Washington 2003 All Lower Montgomery Upper Montgomery PG County DC Arl/Alex/Falls Church South Fairfax/PW West Fairfax/Loudoun Male Female Household with Children 0-4 Years in Washington 5-9 Years Years 20+ Years Federal Gov't Employees 52% 52% 53% 46% 52% 42% 47% 44% 47% 49% 49% 54% 52% 62% 60% 60% Income under $25,000 $25-$50,000 $50-$100,000 $100-$200,000 $200, % 55% 51% 54% 50% 0% 20% 40% 60% 80% 100%
119 119 Liberal Washington 2003 All Orthodox Conservative Reconstructionist Reform Just Jewish 27% 52% 47% 50% 54% 57% In-married Conversionary Intermarried Synagogue Member Non-Member JCC Member Non-Member Jewish Organization Member Non-Member Donated to Federation Asked, Did not Donate Not Asked 49% 53% 50% 54% 51% 53% 52% 50% 50% 54% 63% 62% Federation Non-Donor Under $100 $ % 48% 50% 0% 20% 40% 60% 80% 100%
120 120 Conservative Washington 2003 All Lower Montgomery Upper Montgomery PG County DC Arl/Alex/Falls Church South Fairfax/PW West Fairfax/Loudoun 11% 14% 14% 12% 4% 9% 15% 9% Male Female 8% 15% Household with Children 0-4 Years in Washington 5-9 Years Years 20+ Years Federal Gov't Employees 10% 12% 10% 8% 12% 8% Income under $25,000 $25-$50,000 $50-$100,000 $100-$200,000 $200, % 13% 12% 10% 8% 0% 20% 40% 60% 80% 100%
121 121 Conservative Washington 2003 All Orthodox Conservative Reconstructionist Reform Just Jewish In-married Conversionary Intermarried Synagogue Member Non-Member JCC Member Non-Member Jewish Organization Member Non-Member Donated to Federation Asked, Did not Donate Not Asked 11% 23% 16% 6% 10% 9% 10% 5% 10% 12% 10% 11% 11% 11% 17% 14% 10% 10% Federation Non-Donor Under $100 $ % 12% 14% 0% 20% 40% 60% 80% 100%
122 % Political View by Age Bergen 2001 Liberal Moderate Conservative 80% 60% 60% 40% 47% 44% 45% 43% 48% 40% 42% 46% 33% 20% 9% 12% 12% 12% 7% 0% Under
123 123 Political Party and Political View Bergen 2001 Liberal Democrat 38% Conserv Republican 5% Moderate Republican 5% Liberal Republican 2% Other 4% Conserv. Independent 2% Moderate Independent 12% Moderate Democrat 23% Liberal Independent 5% Conservative Democrat 4%
124 124 Registered to Vote
125 % Registered to Vote by Age Orlando % 92% 90% 93% 84% 80% 60% 40% 20% 0% Under
126 % Registered to Vote by Age Harrisburg % 95% 92% 91% 83% 80% 60% 40% 20% 0% Under
127 % Registered to Vote by Age St. Petersburg % 93% 89% 95% 80% 81% 60% 40% 20% 0% Under
128 % 91% Registered to Vote by Age 94% Richmond % 100% 94% 80% 60% 40% 20% 0% Under
129 % 94% Registered to Vote by Age Washington % 97% 95% 95% 80% 60% 40% 20% 0% Under
130 % 94% Registered to Vote by Age West Palm Beach % 97% 95% 91% 80% 60% 40% 20% 0% Under
131 % Registered to Vote by Age South Palm Beach % 99% 98% 83% 82% 80% 60% 40% 20% 0% Under
132 % Registered to Vote by Age Bergen % 97% 93% 91% 80% 82% 60% 40% 20% 0% Under
133 133 All Registered to Vote Washington % Lower Montgomery Upper Montgomery PG County DC Arl/Alex/Falls Church South Fairfax/PW West Fairfax/Loudoun Male Female Household with Children 0-4 Years in Washington 5-9 Years Years 20+ Years Income under $25,000 $25-$50,000 $50-$100,000 $100-$200,000 $200, % 97% 90% 96% 95% 99% 97% 96% 96% 98% 93% 98% 95% 97% 87% 92% 97% 98% 95% 0% 20% 40% 60% 80% 100%
134 134 Registered to Vote Washington 2003 All Orthodox Conservative Reconstructionist Reform Just Jewish In-married Conversionary Intermarried Synagogue Member Non-Member JCC Member Non-Member Jewish Organization Member Non-Member Donated to Federation Asked, Did Not Donate Not Asked 96% 93% 96% 100% 97% 95% 98% 97% 97% 97% 95% 97% 96% 97% 96% 98% 99% 94% Federation Non-Donor Donated under $100 Donated $ % 98% 99% 0% 20% 40% 60% 80% 100%
135 135 Registered to Vote Washington 2003 All 96% Republican 98% Democrat 97% Independent 94% Liberal 98% Moderate 96% Conservative 90% 0% 20% 40% 60% 80% 100%


136 136 Politically Active
137 137 Engaged in Political Activity in the Past Year 100% 90% 80% Percentage of Households 70% 60% 50% 40% 30% 28% 38% 34% 35% 32% 20% 10% 0% Northeast Midwest South West US Data are for the more Jewishly-connected sample of 4.3 million Jews.
138 % Participate in Political Activities by Age Washington % 60% 48% 47% 50% 46% 45% 40% 39% 20% 0% Under All
139 % Participate in Political Activities by Age Bergen % 60% 40% 27% 31% 41% 29% 35% 34% 20% 0% Under All
Jewish Community Study
 1 The 2008 Greater Middlesex Jewish Community Study Ira M. Sheskin, Ph.D. Director of the Jewish Demography Project of the Sue and Leonard Miller Center for Contemporary Judaic Studies and Associate Professor,
Jewish Community Study
 1 The 2008 Greater Middlesex Jewish Community Study Ira M. Sheskin, Ph.D. Director of the Jewish Demography Project of the Sue and Leonard Miller Center for Contemporary Judaic Studies and Associate Professor,
Guide for Interviewers Seeking Community Estimates
 North American Jewish Data Bank US Jewish Community Population Estimation Procedure: Guide for Interviewers Seeking Community Estimates Arnold Dashefsky, Ph.D. Doris and Simon Konover Chair of Judaic Studies
Jewish Community Study
 1 The 2008 Greater Middlesex Jewish Community Study Ira M. Sheskin, Ph.D. Director of the Jewish Demography Project of the Sue and Leonard Miller Center for Contemporary Judaic Studies and Associate Professor,
The 2018 Jewish Federation of Metropolitan Detroit Population Study: Twelve Major Findings
 1 The 2018 Jewish Federation of Metropolitan Detroit Population Study: Twelve Major Findings Ira M. Sheskin, Ph.D. Director of the Jewish Demography Project of the Sue and Leonard Miller Center for Contemporary
The 2018 Jewish Federation of Metropolitan Detroit Population Study: A Portrait of the Detroit Community
 1 The 2018 Jewish Federation of Metropolitan Detroit Population Study: A Portrait of the Detroit Community Jewish Education Congregational Schools Ira M. Sheskin, Ph.D. Director of the Jewish Demography
Jewish Community Study
 1 The 2008 Greater Middlesex Jewish Community Study Ira M. Sheskin, Ph.D. Director of the Jewish Demography Project of the Sue and Leonard Miller Center for Contemporary Judaic Studies and Associate Professor,
Jewish Population of Broward County
 1 Jewish Population of County Ira M. Sheskin, Ph.D. Director of the Jewish Demography Project of the Sue and Leonard Miller Center for Contemporary Judaic Studies and Associate Professor, Department of
College Students. The 2018 Jewish Federation of Metropolitan Detroit Population Study: A Portrait of the Detroit Community
 1 The 2018 Jewish Federation of Metropolitan Detroit Population Study: A Portrait of the Detroit Community College Students Ira M. Sheskin, Ph.D. Director of the Jewish Demography Project of the Sue and
Mandell L. Berman Institute North American Jewish Data Bank, Center for Judaic Studies and Contemporary Jewish Life
 THIS PUBLICATION IS PROVIDED BY THE NORTH AMERICAN JEWISH DATA BANK WITH PERMISSION FROM THE STUDY AUTHORS. THE NORTH AMERICAN JEWISH DATA BANK IS A COLLABORATIVE PROJECT OF THE JEWISH FEDERATIONS OF NORTH
American Values Atlas 2016 January 6, 2016 January 10, 2017 N = 101,438
 American Values Atlas 2016 January 6, 2016 January 10, 2017 N = 101,438 RELIG What is your present religion, if any? Are you Protestant, Roman Catholic, Mormon, Orthodox such as Greek or Russian Orthodox,
Ten Facts about Geographic Patterns of the Orthodox Church Life in the United States p.2
 Alexei Krindatch, Research Coordinator (akrindatch@aol.com) Assembly of Canonical Orthodox Bishops of North and Central America Ten Facts about Geographic Patterns of the Orthodox Church Life in the United
Elderly Jews: An Increasing Priority for the American Jewish Community?
 Ira M. Sheskin Changing Jewish Communities 58, 15 July 2010, 4 Av 5770 Elderly Jews: An Increasing Priority for the American Jewish Community? The American Jewish community is rapidly aging. The absolute
By Alexei Krindatch Standing Conference of the Canonical Orthodox Bishops in the Americas
 By Alexei Krindatch Standing Conference of the Canonical Orthodox Bishops in the Americas The data is now available from the 2010 US Orthodox Christian Census which was completed as a part of the national
Number of Jews in the world with emphasis on the United States and Israel
 Number of Jews in the world with emphasis on the United States and Israel On the 20 th of December, 2010, the Steinhardt Institute in Brandeis University published new data regarding the size of the Jewish
ELEMENTARY SPEECH BIBLE MEMORIZATION SAMPLER
 ELEMENTARY SPEECH BIBLE MEMORIZATION SAMPLER 2017/18 Contents Important Information 3 Bible Memorization 4 Bible Memorization Sampler 2017/18 2 2017, Association of Christian Schools International Bible
Number 1 Young Adult Catholics in the Context of Other Catholic Generations
 Number 1 Young Adult Catholics in the Context of Other Catholic Generations Young Adult Catholics in the Context of Other Catholic Generations: Living with Diversity, Seeking Service, Waiting to be Welcomed
A PRAYER in HONOR of MARY
 A PRAYER in HONOR of MARY Blessed are you among all women! The Immaculate Conception, Patroness of the U. S. A. Our Lady of Guadalupe, Patroness of the Americas. Coming together as the brothers and sisters
CRT. FIELD FINAL - FEBRUARY 22, 2000 (Columns are ABSOLUTE) (Revisions on last page [4])
![CRT. FIELD FINAL - FEBRUARY 22, 2000 (Columns are ABSOLUTE) (Revisions on last page [4])](/thumbs/77/76054632.jpg "CRT. FIELD FINAL - FEBRUARY 22, 2000 (Columns are ABSOLUTE) (Revisions on last page [4])") CRT FIELD FINAL - FEBRUARY 22, 2000 (Columns are ABSOLUTE) (Revisions on last page [4]) RCI,GAL48517 R517 AC4287 The Gallup Organization, Inc. Project Registration #129405 GALLUP POLL APPROVED BY CLIENT
CRT FIELD FINAL - FEBRUARY 22, 2000 (Columns are ABSOLUTE) (Revisions on last page [4]) RCI,GAL48517 R517 AC4287 The Gallup Organization, Inc. Project Registration #129405 GALLUP POLL APPROVED BY CLIENT
Building & leading teams who value culture, diversity, and inclusion Intermountain Cultural Competence Symposium
 Building & leading teams who value culture, diversity, and inclusion Intermountain Cultural Competence Symposium Kim Henrichsen, Vice President of Clinical Operations and Chief Nursing Officer and Tammy
Church Information Form (Part II) Step 1 of 7
 Step 1 of 7") Church/Organization ID Church/Organization Name, City, State Rev. 9/2009 Church Information Form (Part II) Step 1 of 7 Position To Be Filled (select one) Associate Pastor (Christian Education) Associate
Church/Organization ID Church/Organization Name, City, State Rev. 9/2009 Church Information Form (Part II) Step 1 of 7 Position To Be Filled (select one) Associate Pastor (Christian Education) Associate
Military Council of Catholic Women PO Box 4456, Washington, DC 20017
 Dear Women of MCCW, We are so looking forward to being with you at your retreat in just a few short weeks and enjoying the beauty and stillness offered in a retreat. In that prayerful, quiet time we will
The 2007 Jewish Community Study of the Lehigh Valley. Main Report Volume I: Chapters 1-7
 The 2007 Jewish Community Study of the Lehigh Valley Main Report Volume I: Chapters 1-7 Ira M. Sheskin, Ph.D. Director of the Jewish Demography Project of the Sue and Leonard Miller Center for Contemporary
Unaffiliated Lay Vincentians' Informal Engagement with the Vincentian Mission
 Via Sapientiae: The Institutional Repository at DePaul University Vincentian Digital Books Vincentian Heritage Collections 6-1-2014 Unaffiliated Lay Vincentians' Informal Engagement with the Vincentian
A Patriotic Rosary. April 25, 2016
 A Patriotic Rosary April 25, 2016 Apostles Creed I believe in God, the Father Almighty, Creator of heaven and earth; and in Jesus Christ, His only Son, our Lord: Who was conceived by the Holy Spirit, born
2016 GREATER HOUSTON JEWISH COMMUNITY STUDY
 2016 GREATER HOUSTON JEWISH COMMUNITY STUDY Initial Report December 20161 Geographic Areas of Houston Zip Code Numbers without 77 and without leading zeros Example: The 24 on the map is 77024 382 North
THE CARRIE BURTON OVERTON COLLECTION. Papers, (Predominantly ) 5 linear feet
 5 linear feet") THE CARRIE BURTON OVERTON COLLECTION Papers, 1870-1970 (Predominantly 1900-1970) 5 linear feet Accession Number 340 L.C. Number The papers of Carrie Burton Overton were placed in the Archives of Labor
THE CARRIE BURTON OVERTON COLLECTION Papers, 1870-1970 (Predominantly 1900-1970) 5 linear feet Accession Number 340 L.C. Number The papers of Carrie Burton Overton were placed in the Archives of Labor
Major Themes of This Study
 Major Themes of This Study A Slowly Growing Community 17,500 persons live in 8,800 Jewish households in Sarasota-Manatee. Of the 17,500 persons, 89% (15,500 persons) are Jewish. The number of Jewish households
HIGH POINT UNIVERSITY POLL MEMO RELEASE 2/10/2017 (UPDATE)
") ELEMENTS Population represented Sample size Mode of data collection Type of sample (probability/nonprobability) HIGH POINT UNIVERSITY POLL MEMO RELEASE 2/10/2017 (UPDATE) DETAILS Adults in North Carolina
ELEMENTS Population represented Sample size Mode of data collection Type of sample (probability/nonprobability) HIGH POINT UNIVERSITY POLL MEMO RELEASE 2/10/2017 (UPDATE) DETAILS Adults in North Carolina
Muhlenberg College/Morning Call. Lehigh Valley/Trump/Presidential Election Poll
 Muhlenberg College/Morning Call Lehigh Valley/Trump/Presidential Election Poll The following report contains the results of a telephone survey of 416 registered voters in Lehigh and Northampton Counties
RELIGIOUS BODIHS P L A T H S 4 7 ^ - 4 L>2
 RELIGIOUS BODIHS P L A T H S 4 7 ^ - 4 L>2 RELIGIOUS BODIES. P l a t e No. 479 480 481 482 483 484 485 486 Title. 1. Proportion of the population reported as Protestant, Roman Catholic, and all other church
HIGH POINT UNIVERSITY POLL MEMO RELEASE 4/7/2017 (UPDATE)
") ELEMENTS Population represented Sample size Mode of data collection Type of sample (probability/nonprobability) HIGH POINT UNIVERSITY POLL MEMO RELEASE 4/7/2017 (UPDATE) DETAILS Adults in North Carolina.
ELEMENTS Population represented Sample size Mode of data collection Type of sample (probability/nonprobability) HIGH POINT UNIVERSITY POLL MEMO RELEASE 4/7/2017 (UPDATE) DETAILS Adults in North Carolina.
Dear Future Missionary,
 Dear Future Missionary, Have fun coloring and working through the pages of this book! Here you will learn about the North American Mission Board and our plan to help start new churches across North America.
Partial List of Past Events, Marcia McFee, Ph.D.!
 ! Partial List of Past Events, Marcia McFee, Ph.D.!! Worship Design and Keynote Speaker, Michigan Pastor s School UMC, East Lansing, MI, 14" Worship Design and Workshop Leader, PCUSA Evangelism and Church
How Nationwide Presidential Campaigns Would Be Run January 7, 2017
 How Nationwide Presidential Campaigns Would Be Run January 7, 2017 The shortcomings of the current system of electing the President stem from state winner-takeall laws (i.e., laws in 48 states that award
Great American Award Program
 Great American Award Program August 2010 Dear Parents, All Fifth Graders will be participating in the Great American Award program this year. The Great American Award program fits into our curriculum beautifully
Records of the Executive Relief Committee for the Earthquake of 1886
 Records of the Executive Relief Committee for the Earthquake of 1886 Repository Charleston Archive, Charleston County Public Library. 68 Calhoun Street, Charleston, SC 29401. 843-805-6967. Title Records
April 11, Dear Member of Congress,
 April 11, 2016 Dear Member of Congress, We write to you as communities of faith to ask your support for the U.S. pledge to the Green Climate Fund (GCF) and the President s FY2017 budget request of $750
AMERICAN JEWISH OPINION
 1997 ANNUAL SURVEY OF AMERICAN JEWISH OPINION Conducted for the American Jewish Committee by Market Facts, Inc. February 3-11, 1997 The American Jewish Committee The Jacob Blaustein Building 165 East 56th
Denominational Variations Across Jewish Communities
 Denominational Variations Across Jewish Communities Harriet Hartman Department of Sociology, Rowan University Ira Sheskin Department of Geography Jewish Demography Project, Sue and Leonard Miller Center
NEWS AND RECORD / HIGH POINT UNIVERSITY POLL MEMO RELEASE 3/29/2018
 NEWS AND RECORD / HIGH POINT UNIVERSITY POLL MEMO RELEASE 3/29/2018 ELEMENTS Population represented Sample size Mode of data collection Type of sample (probability/nonprobability) Start and end dates of
Population in the United States, 2006
 Population in the United States, 2006 3TARTING WITH THIS ISSUE of the American Jewish Year Book nereailer AJYB) responsibility for producing annual estimates of the Jewish population of the United States
EMBARGOED FOR RELEASE: Thursday, Sept. 8 at 4:00 p.m.
 Interviews with 1,001 adult Americans conducted by telephone by ORC International on September 1-4, 2016. The margin of sampling error for results based on the total sample is plus or minus 3 percentage
2018 Detroit Jewish Population Study Summary Report
 2018 Detroit Jewish Population Study Summary Report The 2018 Detroit Jewish Population Study: A Portrait of the Detroit Jewish Community Summary Report Ira M. Sheskin Professor Department of Geography
Survey of Jews in Illinois 9 th Congressional District October 18-24, 2010
 Survey of Jews in Illinois 9 th Congressional District October 18-24, 2010 J Street Survey of Jewish Voters, IL 9th CD October 18-24, 2010 Figure 1 Methodology Survey conducted October 18-24, 2010 400
GW POLITICS POLL 2018 MIDTERM ELECTION WAVE 3
 GW POLITICS POLL 2018 MIDTERM ELECTION WAVE 3 The survey was fielded 17 25, 2018 by YouGov with a sample of registered voters. This was the third survey in a four-wave panel design focusing on the 2018
Results of SurveyUSA News Poll # Page 1
 Even in Solid-Blue California, With More Democrats Watching, Romney Is Clear Winner of 1st Presidential Debate: Immediately following tonight's presidential debate between Republican Mitt Romney and Democrat
HIGH POINT UNIVERSITY POLL MEMO RELEASE (UPDATE) 3/2/2016
 3/2/2016") ELEMENTS Population represented Sample size Mode of data collection Type of sample (probability/nonprobability) HIGH POINT UNIVERSITY POLL MEMO RELEASE (UPDATE) 3/2/2016 DETAILS Adults in North Carolina.
ELEMENTS Population represented Sample size Mode of data collection Type of sample (probability/nonprobability) HIGH POINT UNIVERSITY POLL MEMO RELEASE (UPDATE) 3/2/2016 DETAILS Adults in North Carolina.
1 0 t h A n n u a l N a t i o n a l P r e s i d e n t s A w a r d. f o r M a r k e t i n g E x c e l l e n c e
 1 0 t h A n n u a l N a t i o n a l P r e s i d e n t s A w a r d f o r M a r k e t i n g E x c e l l e n c e B e P r e p a r e d f o r n e x t y e a r! A n e w c a t e g o r y, B e s t 1 0 0 t h A n n
Yellow Roses, Sashes and Signs: Voices of the Women s Suffrage Movement
 Yellow Roses, Sashes and Signs: Voices of the Women s Suffrage Movement JENNIFER H. JASO, Ed.D. jenniferjaso@flche.net FLORIDA COUNCIL FOR HISTORY EDUCATION AND SARASOTA COUNTY SCHOOLS Historical Thinking
HIGH POINT UNIVERSITY POLL MEMO RELEASE 3/31/2015
 HIGH POINT UNIVERSITY POLL MEMO RELEASE 3/31/2015 ELEMENTS Population represented Sample size Mode of data collection Type of sample (probability/nonprobability) Start and end dates of data collection
Russian American Jewish Experience
 Russian American Jewish Experience RAJE Background & Long Term Impact of the RAJE Fellowship Program Results of the Research Institute for New Americans (RINA) Long Term Impact Study FROM LET MY PEOPLE
Survey of Young Americans Attitudes toward Politics and Public Service 26th Edition: September 26 October 9, 2014
 Survey of Young Americans Attitudes toward Politics and Public Service 26th Edition: September 26 October 9, 2014 N=2,029 18-29 Year Olds in English and Spanish (with GfK KnowledgePanel i ) Margin of Error
Dear Speaker Ryan, Majority Leader McConnell, Chairman Brady, and Chairman Hatch:
 The Honorable Paul Ryan Speaker of the House H-232 The Capitol Washington, D.C. 20515 The Honorable Kevin Brady Chairman, House Ways & Means Committee 1011 Longworth House Office Building Washington, D.C.
UPDATED November 1, The Honorable Mitch McConnell Senate Majority Leader S-230 The Capitol Washington, D.C
 UPDATED November 1, 2017 The Honorable Paul Ryan Speaker H-232 The Capitol The Honorable Nancy Pelosi House Democratic Leader H-204 The Capitol The Honorable Kevin Brady Chairman House Ways and Means Committee
Day 6: Kansas-Nebraska Act ( minutes)
") Day 6: Kansas-Nebraska Act (90-120 minutes) Materials to Distribute Kansas-Nebraska Act Text Sheet America Label-me Map 1854 Futility versus Immortality Activity Come to Bleeding Kansas Abolitonist billboard
Day 6: Kansas-Nebraska Act (90-120 minutes) Materials to Distribute Kansas-Nebraska Act Text Sheet America Label-me Map 1854 Futility versus Immortality Activity Come to Bleeding Kansas Abolitonist billboard
1. With regard to school, are you currently enrolled at any of the following? Please select all that apply: Total: 4-Year College
 Survey of Young Americans Attitudes toward Politics and Public Service 18 th Edition: September 24 October 4, 2010 N=2,004 18-29 Year Olds in English and Spanish (with Knowledge Networks) Margin of Error
Identification level of Diaspora Jews with Israel
 1 Identification level of Diaspora Jews with Israel This past April, the American Jewish Committee released its 2010 Annual Survey of American Jewish Opinion. The sample consisted of 800 self-identifying
What is the North American Mission Board (NAMB)? UNITED STATES. Dear Future Missionary,
? UNITED STATES. Dear Future Missionary,") Dear Future Missionary, Have fun coloring and working through the pages of this book! Here you will learn about the North American Mission Board and our plan to help start new churches across North America.
Dear Future Missionary, Have fun coloring and working through the pages of this book! Here you will learn about the North American Mission Board and our plan to help start new churches across North America.
The 2001 Jewish Community Study of Bergen County and North Hudson. Summary Report
 The 2001 Jewish Community Study of Bergen County and North Hudson Summary Report UJA Federation of Bergen County & North Hudson Ira M. Sheskin, Ph.D. Associate Professor Department of Geography and Fellow
Hispanic Members of the Presbyterian Church (U.S.A.): Survey Results
: Survey Results") Hispanic Members of the Presbyterian Church (U.S.A.): Survey Results Teresa Chávez Sauceda May 1999 Research Services A Ministry of the General Assembly Council Presbyterian Church (U.S.A.) 100 Witherspoon
Hispanic Members of the Presbyterian Church (U.S.A.): Survey Results Teresa Chávez Sauceda May 1999 Research Services A Ministry of the General Assembly Council Presbyterian Church (U.S.A.) 100 Witherspoon
Jewish College Students
 National Jewish Population Survey 2000-01 Jewish College Students A United Jewish Communities Presentation of Findings to Hillel: The Foundation for Jewish Campus Life January 2004 NJPS Respondents The
February 24, Dear Mr. President and Members of Congress:
 February 24, 2010 Dear Mr. and Members of Congress: We are communities of faith who have supported comprehensive health care reform for decades. We have also offered vocal support and occasional constructive
The Changing Population Profile of American Jews : New Findings
 The Fifteenth World Congress of Jewish Studies Jerusalem, Israel August, 2009 The Changing Population Profile of American Jews 1990-2008: New Findings Barry A. Kosmin Research Professor, Public Policy
Evangelical Attitudes Toward Israel
 Evangelical Attitudes Toward Israel Representative Survey of 2,002 Americans With Evangelical Beliefs Sponsored by Chosen People Ministries and Author, Joel C Rosenberg 2 Methodology LifeWay Research conducted
Survey Purpose and Background. Findings
 FINAL REPORT Third-Wave Pentecostalism Survey For the Synodical Study Committee to Examine Third-Wave Pentecostalism Rodger R. Rice, Ph.D. June 28, 2006 Survey Purpose and Background To learn the extent
Federations combined with the United Jewish Appeal and the United Israel Appeal.
 Nitzotzot Min HaNer Volume #5, October 2002 The UJC (United Jewish Communities) National Jewish Population Survey 1 (NJPS) of 2000-1 is finally out, though only part of it has been released 2. This comes
Goodman looks like best Dem alternative
 FOR IMMEDIATE RELEASE January 14, 2010 INTERVIEWS: DEAN DEBNAM 888-621-6988 / 919-880-4888 (serious media inquiries only please, other questions can be directed to Tom Jensen) QUESTIONS ABOUT THE POLL:
When I began surveying the landscape of potential candidates I was looking for three things:
 To: From: Conservative & Evangelical Leaders Mark DeMoss (Personally) Date: Subject: The 2008 Presidential Election In about 100 days we will likely have a Republican nominee for president. Most political
Evangelical Attitudes Toward Israel Research Study
 Evangelical Attitudes Toward Israel Research Study Evangelical Attitudes Towards Israel and the Peace Process Sponsored By Chosen People Ministries and Author Joel C. Rosenberg Table of Contents Page Executive
HIGH POINT UNIVERSITY POLL MEMO RELEASE 11/29/2017 (UPDATE)
") HIGH POINT UNIVERSITY POLL MEMO RELEASE 11/29/2017 (UPDATE) ELEMENTS Population represented Sample size Mode of data collection Type of sample (probability/nonprobability) Start and end dates of data collection
HIGH POINT UNIVERSITY POLL MEMO RELEASE 11/29/2017 (UPDATE) ELEMENTS Population represented Sample size Mode of data collection Type of sample (probability/nonprobability) Start and end dates of data collection
A PORTRAIT OF THE INDIANAPOLIS JEWISH COMMUNITY
 A PORTRAIT OF THE INDIANAPOLIS JEWISH COMMUNITY 2017 INDIANAPOLIS JEWISH COMMUNITY STUDY A Portrait of the Indianapolis Jewish Community In your hands is a document that paints a portrait of the Indianapolis
2017 Greater Washington Jewish Community Demographic Study
 2017 Greater Washington Jewish Community Demographic Study Dr. Janet Krasner Aronson Matthew Brookner Dr. Matthew Boxer Prof. Leonard Saxe 11 February 2018 Counting Jews Hosea (2:1) And the number of the
Four Questions about American Jewish Demography
 www.jcpa.org Published June 2008 Jewish Political Studies Review 20:1-2 (Spring 2008) Four Questions about American Jewish Demography Ira M. Sheskin How many Jews live in the United States? Is the number
National Tracking Poll
 National Tracking Poll Project: 161019 N Size: 1794 Likely Voters Margin of Error: ± 2% Topline Report October 27-28, 2016 P1 Question Response Frequency Percentage Now, generally speaking, would you say
Intermarriage Statistics David Rudolph, Ph.D.
 Intermarriage Statistics David Rudolph, Ph.D. I am fascinated by intermarrieds, not only because I am intermarried but also because intermarrieds are changing the Jewish world. Tracking this reshaping
NEWS AND RECORD / HIGH POINT UNIVERSITY POLL MEMO RELEASE 3/1/2017
 ELEMENTS Population represented Sample size Mode of data collection NEWS AND RECORD / HIGH POINT UNIVERSITY POLL MEMO RELEASE 3/1/2017 Type of sample (probability/nonprobability) DETAILS Adults in North
Appendix Demographic summary of sample, by sex
 APPENDIX 1 Demographics and Randomization Appendix Demographic summary of sample, by sex Total Women Men Mean Age 32.3 34.3 30.9 Race Caucasian 74% 74% 74% Asian 11% 10% 12% Black/African American 6% 9%
ABOUT THE STUDY Study Goals
 ABOUT THE STUDY ABOUT THE STUDY 2014 Study Goals 1. Provide a database to inform policy and planning decisions in the St. Louis Jewish community. 2. Estimate the number of Jewish persons and Jewish households
Handout for Tuesday October 27th Patriot Games Leadership Training Call
 Handout for Tuesday October 27th Patriot Games Leadership Training Call IMPORTANT NOTES: Our webinar email invitation and reminder email will be sent out on Fridays. We will send several reminder emails
What Americans (especially Evangelicals) Think About Israel and the Middle East. Principal Investigator: Shibley Telhami
 Think About Israel and the Middle East. Principal Investigator: Shibley Telhami") What Americans (especially Evangelicals) Think About Israel and the Middle East Principal Investigator: Shibley Telhami A survey sponsored by the Sadat Chair for Peace and Development at the University
What Americans (especially Evangelicals) Think About Israel and the Middle East Principal Investigator: Shibley Telhami A survey sponsored by the Sadat Chair for Peace and Development at the University
BAY AREA JEWISH LIFE. Community Study Highlights A PORTRAIT OF AND COMMUNITIES. Published February 13, Commissioned and supported by:
 A PORTRAIT OF BAY AREA JEWISH LIFE AND COMMUNITIES Community Study Highlights Published February 13, 2018 Commissioned and supported by: The Jewish Community Federation of San Francisco, the Peninsula,
The 2008 Jewish Community Study of Greater Middlesex County. Summary Report
 The 2008 Jewish Community Study of Greater Middlesex County Summary Report Ira M. Sheskin, Ph.D. Director of the Jewish Demography Project of the Sue and Leonard Miller Center for Contemporary Judaic Studies
1. With regard to school, are you currently enrolled at any of the following? Please select all that apply:
 Survey of Young Americans Attitudes toward Politics and Public Service 19th Edition: February 11 March 2, 2011 N=3,018 18-29 Year Olds in English and Spanish (with Knowledge Networks i ) Margin of Error
Note: Results are reported by total population sampled; and sub-samples. See final page for details.
 The 11th Biannual Youth Survey on Politics and Public Service Field Dates: October 4 October 16, 2006 Master Questionnaire; N=2,546 18-24 Year Olds Margin of Error: ± 1.9% Note: Results are reported by
The State of Female and Racial/Ethnic United Methodist Clergy in the US
 The State of Female and Racial/Ethnic United Methodist Clergy in the US Eric B. Johnson, Ph.D. April 12, 212 1 Contents 1 Understanding Demographic Shifts in the Representation of Female and Racial/Ethnic
NATIONAL: U.S. CATHOLICS LOOK FORWARD TO POPE S VISIT
 Please attribute this information to: Monmouth University Poll West Long Branch, NJ 07764 www.monmouth.edu/polling Follow on Twitter: @MonmouthPoll CONTACTS: For commentary on poll results and the pope
What We Learned from the 2009 Passover/Easter Survey By Micah Sachs
 What We Learned from the 2009 Passover/Easter Survey By Micah Sachs Abstract While the confluence of Passover and Easter is not as culturally prominent as the so-called "December dilemma," deciding how
Capitol Point Prayer Trek One Nation under God
 Capitol Point Prayer Trek One Nation under God Final Prayers at the National Monument in Plymouth, MA Monday, October 19, 2015 2:00 p.m. EDT Opening Prayer: Our Heavenly Father, who is the God of Abraham,
NALEO Latino Battleground State Surveys: Arizona, Florida, Nevada, and North Carolina
 NALEO Latino Battleground State Surveys: Arizona, Florida, Nevada, and Carolina Q1. Thinking ahead to the November 2016 election, what would you say the chances are that you will vote in the election for
National Tracking Poll
 National Tracking Poll Project: 171203 N Size: 1955 Registered Voters Margin of Error: ± 2% Topline Report December 08-11, 2017 P1 Question Response Frequency Percentage Now, generally speaking, would
The 2017 Indianapolis Jewish Population Study: A Portrait of the Indianapolis Jewish Community
 The 2017 Indianapolis Jewish Population Study: A Portrait of the Indianapolis Jewish Community Main Report Volume II, Chapters 8-15 Ira M. Sheskin Professor and Chair Department of Geography University
EMBARGOED FOR RELEASE: Monday, June 20 at 4:00 p.m.
 Interviews with 1,001 adult Americans conducted by telephone by ORC International on June 16-19, 2016. The margin of sampling error for results based on the total sample is plus or minus 3 percentage points.
WBUR Poll Survey of 504 Registered Voters in Massachusetts Field Dates: January 5-7, 2018
 Conducted for WBUR by WBUR Poll Survey of 504 Registered Voters in Massachusetts Field Dates: January 5-7, 2018 Overall, do you think things in Massachusetts are headed in the right direction, or are they
Mission Statements of Consortium Member Parishes. Colorado St. John s Cathedral, Denver: To know Christ and to make Christ known.
 Mission Statements of Consortium Member Parishes California St. James, Los Angeles: Our mission is to enable individuals to discern and carry out their ministries as Christians. Our goal is to become,
Pine Valley United Methodist Church
 Pine Valley United Methodist Church 910 Pine Valley rd. Jacksonville, NC 28546 pinevalleyumc.org [ Note: Pine Valley A Way Forward Team will meet the congregation next Sunday, 4/15, 3 pm in the sanctuary
JEWISH EDUCATIONAL BACKGROUND: TRENDS AND VARIATIONS AMONG TODAY S JEWISH ADULTS
 JEWISH EDUCATIONAL BACKGROUND: TRENDS AND VARIATIONS AMONG TODAY S JEWISH ADULTS Steven M. Cohen The Hebrew University of Jerusalem Senior Research Consultant, UJC United Jewish Communities Report Series
SBCLIFE. Doing More with Less. The Changing face of The cooperative program. by Roger S. Oldham The Cooperative Program has always been
 PAGE 9 WINTER 2013/2014 SBCLIFE The Changing face of The cooperative program Doing More with Less by Roger S. Oldham The Cooperative Program has always been about three things. It is about people training
National Tracking Poll
 National Tracking Poll Project: 170205 N Size: 2013 Registered Voters Margin of Error: ± 2% Topline Report February 16-19, 2017 P1 Question Response Frequency Percentage Now, generally speaking, would
WORLDWIDE CHURCH PLANT UPDATE
 New Places for New People Goals for the Denomination The United Methodist Church established the following goals for the most recent quadrennium related to new church development worldwide: by the end