Report on Jewish Poverty
|
|
|
- Sheryl Harris
- 5 years ago
- Views:
Transcription
1 Report on Jewish Poverty January 2004 Commissioned by Metropolitan Council on Jewish Poverty and UJA-Federation of New York based on UJA-Federation of New York s JEWISH COMMUNITY STUDY OF NEW YORK : 2002
2 UJA-Federation Leadership Metropolitan Council on Jewish Poverty Leadership President Larry Zicklin* Chair of the Board Morris W. Offit* Executive Vice President & CEO John S. Ruskay Chair, Caring Commission Cheryl Fishbein* Chair, Commission on Jewish Identity and Renewal Scott A. Shay* Chair, Commission on the Jewish People Liz Jaffe* Chair, Jewish Communal Network Commission Stephen R. Reiner* General Campaign Chair Jerry W. Levin* Campaign Chairs Philip Altheim Marion Blumenthal* Philip L. Milstein Daniel S. Och Jodi J. Schwartz Lynn Tobias* Treasurer Paul J. Konigsberg* Secretary Esther Treitel Executive Committee at Large Froma Benerofe* Roger W. Einiger* Matthew J. Maryles* Merryl H.Tisch* Marc A. Utay* Erika Witover* Roy Zuckerberg* Senior Vice President Paul M. Kane Vice President for Agency and External Relations Louise B. Greilsheimer Vice President for Strategic Planning and Organizational Resources Alisa Rubin Kurshan Chief Financial Officer Irvin A. Rosenthal Executive Vice Presidents Emeriti Ernest W. Michel Stephen D. Solender Jewish Community Study of New York: 2002 Committee Chairs Nicki Tanner Judah Gribetz Executive Director, Educational Resources & Organizational Development and Study Director Lyn Light Geller Commission Communications Director and Study Project Manager Laura Sirowitz *Executive Committee member President Joseph C. Shenker, Esq. Chairman of the Board Merryl H.Tisch Executive Director & CEO William E. Rapfogel First Vice President Israel Englander Vice Presidents Shonni J. Silverberg, M.D. Richard B. Stone Secretary Aaron S. Gurwitz, Ph.D. Treasurer Judy Wesalo Temel Board of Directors Abraham Biderman Jeffrey Bogatin Gerald Feldhamer Saul Kamelhar Rabbi Haskel Lookstein Benjamin Lopata Menachem Lubinsky Martin Minkowitz, Esq. Toby Nussbaum Charles A. Posner Steven Price Richard N. Runes Noel J. Spiegel Esta Eiger Stecher, Esq. Thomas Steinberg Joseph C. Strasburg Chief Financial Officer Herb Friedman Chief Operating Officer Peter R. Brest Chief of Staff and Report Director Ilene S. Marcus Senior Executive Consultant Rabbi David Cohen Director of Career Services Sandra Greenstein Director of Child/Family Health Plus Lisa Gaon Director of Community Network Karen Ginnis Director of Crisis Intervention Jackie Ebron Director of External Affairs Kalman Yeger Director of Housing Gary Gutterman Director of Home Care Joyce Traina, R.N. Director of Home Services Valeriya Beloshkurenko Director of Kosher Food Network Benny Wechsler Senior Policy Analyst Deann Forman Director of Social Services Arthur Patsiner
3 Report on Jewish Poverty Authors: Jacob B. Ukeles, Ph.D. President, Ukeles Associates Inc. David A. Grossman President, The Nova Institute Commissioned by Metropolitan Council on Jewish Poverty and UJA-Federation of New York based on UJA-Federation of New York s JEWISH COMMUNITY STUDY OF NEW YORK : 2002
4 Acknowledgments The Report on Jewish Poverty is based on data collected in UJA-Federation s Jewish Community Study of New York: 2002 which was underwritten by generous legacies and bequests to UJA-Federation of New York. Special thanks to the Jean and Albert Nerken Population Study Fund for its continuing support. We are also grateful for additional support from the following study partners: Berger Foundation; E.F. Robbins Foundation; and FJC, a Foundation of Donor Advised Funds. Special thanks to the Nathan Cummings Foundation for their generous grant for this Report on Jewish Poverty and related conferences and advocacy efforts.
5 Letter to the Community UJA-Federation of New York and the Metropolitan Council on Jewish Poverty are pleased to present our 2004 Report on Jewish Poverty.This report is based on data collected in UJA-Federation's Jewish Community Study of New York: It is vitally important that the terrible reality of Jewish poverty, a condition that impacts large segments of the New York Jewish community, be studied and become better known. Many in the New York Jewish community and beyond believe the very existence of Jewish poverty to be a non-issue. But Jewish poverty is not an oxymoron; many of us on the front lines encounter it on a daily basis. Our 2004 Report on Jewish Poverty sheds light on this dramatic increase in poverty, which is due in large part to demographic changes in our community. Met Council published two previous reports on Jewish poverty, in 1981 and 1993.The 1981 report revealed higher-than-expected levels of poverty in the Jewish community. Met Council's 1993 report was based primarily on UJA-Federation's 1991 New York Jewish Population Study.The 1993 report demonstrated the effects of recent immigration and the beginning of the aging of the Jewish population, both of which continue to contribute significantly to Jewish poverty levels today. Met Council and UJA-Federation chose to collaborate on the 2004 Report on Jewish Poverty to demonstrate the need for a substantial and widespread response to the shockingly high level of Jewish poverty. While UJA-Federation, Met Council, and other agencies have and must continue to respond to the challenge of Jewish poverty, additional strategies are required. In particular, as highlighted in the 2004 report, the condition of the "near poor" those whose household incomes are above the level at which they would be able to receive most governmental assistance calls for attention. Met Council, together with the other agencies in the UJA-Federation network, will continue providing this critical assistance to poor and near poor households in New York. This report is an important step in a lengthy community-wide process to combat Jewish poverty.we are proud to stand together in this effort. Larry Zicklin President, UJA-Federation of New York Joseph C. Shenker, Esq. President, Metropolitan Council on Jewish Poverty John S. Ruskay Executive Vice President & CEO, UJA-Federation of New York William E. Rapfogel Executive Director & CEO, Metropolitan Council on Jewish Poverty
6 TABLE OF CONTENTS EXECUTIVE SUMMARY 1 Geography Service Needs Near Poor Conclusion Chapter One: PURPOSE AND FOCUS OF REPORT ON JEWISH POVERTY 5 Defining Jewish Poverty in New York City Does the Choice of a Poverty Standard Matter? Jewish Poverty in New York and the Nation Trends in New York-Area Jewish Poverty Compared to Overall National Trends New York City s Poor Jews and Other Poor New Yorkers Report Organization Chapter Two: JEWISH POVERTY IN THE NEW YORK AREA 11 Jewish Poverty 2002: City and Suburbs Chapter Three: JEWISH POVERTY IN NEW YORK CITY IN Dimensions of Poverty Age Distribution of the Jewish Poor Gender Distribution of the Jewish Poor Marital Status Household Size Russian-Speaking Households Employment and Occupational Status Educational Attainment Religious Affiliation Change Since 1991 Chapter Four: THE GEOGRAPHIC DISTRIBUTION OF JEWISH POVERTY WITHIN NEW YORK CITY 23 Boroughs Principal Jewish Areas Jewish Poverty in Brooklyn Jewish Poverty in Queens Jewish Poverty in The Bronx Jewish Poverty in Manhattan Jewish Poverty in Staten Island Chapter Five: SERVICE NEEDS OF THE JEWISH POOR IN NEW YORK CITY 47 Description of Needs Chapter Six: THE NEAR POOR IN THE NEW YORK AREA JEWISH COMMUNITY 51 Estimating the Jewish Near Poor Barely Making Ends Meet A NOTE ON METHODOLOGY: REPORT ON JEWISH POVERTY 55 The Survey Research Definitions Research Process Number of Calls Response Rate Interview Cooperation Rate Sampling and Estimation Procedures: Stratified Random Sampling Estimation and Weighting Sampling Error Estimates New York Area: 1991 and 2002 Study Comparisons Poverty Guidelines Poverty Level Calculations
7 LIST OF EXHIBITS EXECUTIVE SUMMARY Exhibit ES.1 Groups in Poverty, New York City Jewish Community, Exhibit ES.2 Poor and Near-Poor People in Eight-County New York-Area Jewish Households, Chapter One: PURPOSE AND FOCUS OF REPORT ON JEWISH POVERTY Exhibit 1.1 Poverty Guidelines, Basic and Adjusted, Exhibit 1.2 Number of Jewish Poor in Eight-County New York Area Under Basic and Adjusted Poverty Guidelines, Chapter Two: JEWISH POVERTY IN THE NEW YORK AREA Exhibit , Number and Percent of People in Poor Jewish Households in the Eight-County New York Area 11 Exhibit , Number and Percent of People in Poor Jewish Households in the Eight-County New York Area 12 Chapter Three: JEWISH POVERTY IN NEW YORK CITY IN 2002 Exhibit 3.1 Groups in Poverty, New York City Jewish Community, Exhibit 3.2 Age Distribution, People in Poor and Non-Poor Jewish Households, New York City, Exhibit 3.3 Gender Distribution, People in Poor Jewish Households, New York City, Exhibit 3.4 Marital Status, Respondents in Poor and Non-Poor Jewish Households, New York City, Exhibit 3.5 Percent of All Jewish Households that Are Poor by Household Size, New York City, Exhibit 3.6 People in Poor and Non-Poor Russian-Speaking Jewish Households, New York City, Exhibit 3.7 Employment and Status of Poor and Non-Poor Adults in Jewish Households, New York City, 2002, as Percent of Total 19 Exhibit 3.8 Educational Attainment, Poor and Non-Poor Adults in Jewish Households, New York City, Exhibit 3.9 Religious Affiliation of Respondents in Poor and Non-poor Jewish Households, New York City, Exhibit 3.10 Jewish Refugees from the Former Soviet Union, Chapter Four: THE GEOGRAPHIC DISTRIBUTION OF JEWISH POVERTY WITHIN NEW YORK CITY Exhibit 4.1 Number and Percent of People in Poor Jewish Households by Borough, New York City, Exhibit 4.2 Total Number of People in Jewish Households, Number and Percent of People in Poor Jewish Households, By Principal Jewish Areas, New York City Exhibit 4.3 Selected Data for Brooklyn 27 Exhibit 4.4 Selected Data for Queens 31 Exhibit 4.5 Selected Data for The Bronx 35 Exhibit 4.6 Selected Data for Manhattan 39 Exhibit 4.7 Selected Data for Staten Island 43 Chapter Five: SERVICE NEEDS OF THE JEWISH POOR IN NEW YORK CITY Exhibit 5.1 Percent of Poor and Non-Poor Jewish Households that Sought Assistance for Health and Human Services in the Preceding 12 Months, New York City, Chapter Six: THE NEAR POOR IN THE NEW YORK-AREA JEWISH COMMUNITY Exhibit 6.1 Estimating the Number of Near-Poor People in Jewish Households, Eight-County New York Area, Exhibit 6.2 Estimates of Near-Poor Jewish Households and Near-Poor People, Eight-County New York Area, A NOTE ON METHODOLOGY: REPORT ON JEWISH POVERTY Exhibit A.1 Jewish Community Study of New York: 2002 Poverty Sub-Question Amounts 61 Exhibit A.2 Estimates of Poverty in the New York City Jewish Community, , Using Recalculated 1991 Data 68
8 EXECUTIVE SUMMARY The purpose of this report is to present a comprehensive picture of Jewish poverty in the eight-county New York area. Almost a quarter of a million people live in Jewish households with incomes under 150% of the Federal Poverty Guidelines. These 244,000 poor people represent 15% of the 1.66 million people in all Jewish households in the New York area. 1 In addition there are 104,000 near poor living in Jewish households in the eight-county New York area with incomes only modestly above the poverty line. Thus, a total of 348,000 poor and near-poor people are discussed in this report. Jewish Poverty in New York City Of the 244,000 people living in poor Jewish households, 226,000 (93%) live in New York City. In the city 20% of the people in Jewish households are poor. In the three suburban counties (Nassau, Suffolk, and Westchester), only 18,000 people a little over 3% of the people in Jewish households live in poor households.thus, poverty in New York City is the primary focus of this report. Within New York City, poverty in the Jewish community is not equally distributed; it varies by age and gender, immigration status, household size, marital status, employment, education, and religious denomination. Poverty in the Jewish community is more prevalent among Orthodox households with large families, recent Russian-speaking immigrants, seniors (especially older women living alone), people who are unemployed (especially if they are disabled and unable to work), and people who do not have a college degree. Exhibit ES.1 GROUPS IN POVERTY, NEW YORK CITY JEWISH COMMUNITY, 2002 Number of % of All Larger Orthodox Households (4 or more people, Poor People Poor People all non-russian-speaking, and no one over 65) 60,000 27% Russian-speaking, under 65 52, Russian-speaking, over 65 48, Non-Russian-speaking, over 65 28, Others, including 36, People with a disability & unable to work Unemployed people People with less than a college education Total 226, % 1 Since poverty is determined by income and household size, this report focuses on all (Jewish and non-jewish) people living in Jewish households. 1
9 Geography Jewish poverty in New York City in 2002 was unevenly distributed across the city s boroughs (see Exhibit 4.1). Of the five boroughs, Brooklyn has the most severe Jewish poverty. It has the largest number of people (156,200) living in poor Jewish households, as well as the highest percentage of poor; 30% of all people living in Brooklyn Jewish households are poor. Queens has the second highest number of people in poor Jewish households (42,700) and the second highest percentage (19%). The Bronx has the same percentage of poor as Queens (19%) but a much smaller number (10,400). Manhattan has the third largest number of people in poor Jewish households, but the lowest percentage (4%). Staten Island has relatively few poor people in Jewish households (3,900) and the second lowest percentage (8%). There is also a strikingly different pattern within the boroughs as to the extent to which poor Jewish households are located in the same neighborhoods as are non-poor Jewish households. In Brooklyn, 7% of the people in poor Jewish households live outside of nine principal Jewish areas. On the other hand, there is very little Jewish poverty in Riverdale/Kingsbridge, the largest Jewish area in the Bronx, but there is substantial Jewish poverty in the remainder of the borough. Queens presents a mixed picture. Rego Park/ Forest Hills and The Rockaways (including Far Rockaway) have substantial poverty; Fresh Meadows/Kew Gardens/Hillside has an average level of Jewish poverty; and Northeast Queens has relatively little poverty. There is also substantial Jewish poverty in the remainder of Queens. Jewish poverty in the traditional poor Jewish neighborhoods of Manhattan appears to have declined substantially since the 1993 Met Council report on Jewish poverty which identified the Lower East Side, Upper West Side, and Washington Heights as areas with substantial numbers of people in poor Jewish households. Today, while there undoubtedly are poor Jewish households in these areas, the number of poor Jewish households appears to have declined substantially. There appear to be no major concentrations of Jewish poverty left in Manhattan. Service Needs Among poor Jewish households, 37% reported that they had sought help in coping with a serious or chronic illness during the past 12 months. This level of need among poor households is substantially higher than the 22% of respondents in non-poor Jewish households who had sought such help. While people in non-russian-speaking poor Jewish households are relatively more likely than non-poor household members to have sought help in finding a job (21% versus 14%), only 10% of the Russian-speaking poor reported that they had sought help in finding a job. This may be because the people in a large majority of poor Russian-speaking households are older, suffer from fair-to-poor health, and are effectively not in the labor force. The percentage of all poor households that sought help for a person with a disability (13%) was more than twice as high as the percentage of non-poor households that sought such help. 2
10 Near Poor In addition to the poor Jewish households concentrated in New York City, the eight-county New York area contains many individuals living in households whose economic status can be described as "near poor." About 104,000 people in 53,000 Jewish households in the eight-county New York area can be considered near poor. While most of these near-poor households are located in New York City, about 20% are in the suburbs Suffolk, Nassau, and Westchester Counties.This is a substantially higher percentage than the percentage of poor households in the suburbs. In fact, while there are approximately three times as many poor as near poor in New York City, there are equal numbers of poor and near poor in the three suburban counties. Exhibit ES.2 NUMBER OF POOR AND NEAR-POOR PEOPLE IN EIGHT-COUNTY NEW YORK-AREA JEWISH HOUSEHOLDS, 2002 New York City Suburbs New York Area Poor People in Jewish Households 226,000 18, ,000 Near-poor People in Jewish Households 85,700 18, ,200 Poor & Near Poor in Jewish Households 311,700 36, ,200 Conclusion At the beginning of the 21st century, Jewish poverty in the New York area is a major communal concern. In New York City, 20% of all people living in Jewish households are poor.almost one-quarter of a million people in the eight-county area live in Jewish households with annual incomes below 150% of the poverty guidelines. Another 104,000 live in near-poor Jewish households. The scope of Jewish poverty in New York City and the need for communal assistance can be best understood in the national context of Jewish population numbers.there are as many poor people living in New York City Jewish households 226,000 as there are people living in all Jewish households in Philadelphia or in Boston. 3
11 CHAPTER 1. Purpose and Focus of Report on Jewish Poverty The purpose of this report is to present a comprehensive picture of Jewish poverty in the eight-county New York area. The report focuses primarily on New York City because Jewish poverty in the New York area in 2002 was heavily concentrated in the five boroughs. This initial chapter includes a discussion of definitions of poverty and the reason that 150% of the Federal Poverty Guideline has been used as the benchmark for this report. This chapter also examines poverty in New York in the national context (at 100% of the Federal Poverty Guideline) and compares Jewish poverty in New York to the poverty experienced by other residents of New York City (also at the 100% level). Defining Jewish Poverty in New York City Poverty is both relative and absolute.a family or an individual experiences relative poverty when they have less income and fewer resources than the people around them. In some places Israel and Western Europe, for example poverty is usually defined in relative terms. Often, a household whose income is less than half the median income of all households is considered to be poor. In the United States, poverty tends to be defined in absolute terms. Since the days of the War on Poverty, initiated during President Lyndon B. Johnson s Great Society, poverty in America has usually been measured in terms of the Federal Poverty Guideline.This standard was developed in the early 1960 s, based on estimates of the amount of money that a family needed to buy food for its basic diet, multiplied by three to cover all other essential needs housing, transportation, medical care, etc.the Guideline varies in terms of the number of persons in the family but (except for Alaska) is the same from state to state and in both urban and rural areas. Each year, the federal government revises the Poverty Guideline but only to take inflation into account. 5
12 Exhibit 1.1 shows the Basic Federal Poverty Guideline for 2002 for various sizes of family.this guideline is the same for New York as for any other state. It is the same for Mississippi and Alabama where living costs are far lower than in New York. It is the same in New York City as it is in the rural areas of New York State or elsewhere in the nation. Exhibit 1.1 also shows figures for annual family incomes adjusted to 150% of the Basic Guideline. For the reasons noted below, this Adjusted Guideline is believed to be a more realistic measure of poverty in the New York area where living costs are among the very highest in the nation than is the Basic Guideline. Exhibit 1.1 POVERTY GUIDELINES, BASIC AND ADJUSTED, 2002 Size Basic Federal Adjusted Poverty of Family Poverty Guideline Guideline (150%) 1 $ 8,860 $13, ,940 17, ,020 22, ,100 27, ,180 31, ,260 36, ,340 41, ,420 45,630 Certainly, people whose family incomes fall below the Federal Poverty Guideline are poor whether they live in New York City, in the rural South, or elsewhere in the nation. But in light of the high cost of living in the New York area, many more people are poor than those who have incomes below the Basic Guideline. For this report, as was the case for two previous reports on Jewish poverty published by the Metropolitan Council on Jewish Poverty (in 1983 and 1993), the Adjusted Poverty Guideline has been adopted as the appropriate measure of Jewish poverty for the following reasons: First, New York City has one of the highest costs of living in the country.this is borne out by statistics as well as common sense. For example, the web page of ACCRA (the American Chamber of Commerce Researchers Association) compares living costs in various U.S. cities. It notes that living costs in New York are more than twice as high as in cities such as Atlanta, Baltimore, and Philadelphia. Even if housing costs (which are especially high here) are disregarded, the cost of living in New York is still substantially higher than in these other cities. Obviously, living costs in rural areas of the South are far lower yet. Despite this reality, the Federal Poverty Guideline has been kept at the same level in New York City as for any other location in the nation. 6
13 Second, many city, state, and federal assistance programs, recognizing the unrealistically low level of the Federal Poverty Guideline for New York City, have established eligibility levels that are substantially higher than the Basic Guideline. Here are some examples: New York City s Department of Youth and Community Development uses 125% of the Basic Poverty Guideline; under the federally financed Food Stamp program, families with incomes of up to 130% of the Basic Poverty Guideline are eligible; under the Home Energy Assistance Program (HEAP), eligibility extends to families with incomes of up to 200% of the Basic Poverty Guideline; and under the Section 8 housing assistance program, a family of three with 188% of the Basic Guideline is eligible in the New York area. Third, even the researcher who first proposed the federal poverty standard in the 1960 s, says it is outdated. Anyone who thinks we ought to change it is perfectly right, Mollie Orshansky stated in Her view was borne out by the National Academy of Sciences, which calculated that if the Poverty Guideline was updated for changes in consumption patterns since the 1960s, it should be 45% higher than it is. 1 Finally, the need for a more realistic definition of poverty is evident from a simple examination of the family income levels in Exhibit 1.1.The column showing 150% of the Federal Guideline notes that a family of three persons with less than $22,530 in annual income or a family of four with less than $27,150 would fall below the 150% Guideline. Any such family is clearly poor in terms of what it takes to live in New York today. For these reasons, the definition of poverty adopted for the Jewish Community Study of New York: 2002 and used in the remainder of this report is the Adjusted Poverty Guideline (150% of the Basic Federal Guideline). Does the Choice of a Poverty Standard Matter? The reader may well ask: How much difference is there between the Basic and Adjusted Poverty Guidelines in terms of how many poor Jews there are in the New York Area? Exhibit 1.2 shows the number of poor Jewish households and the number of people in these households in 2002 in terms of each of the two definitions. As can be seen, the numbers of poor people and poor households increase quite substantially when the Adjusted Guideline is adopted.these significant differences underscore the importance of the decision to use the higher standard as a more realistic measure of Jewish poverty in New York. 1. Jared Bernstein, Who s Poor? Don t Ask the Census Bureau, The New York Times, September 26,
14 Exhibit 1.2 NUMBER OF JEWISH POOR IN EIGHT-COUNTY NEW YORK AREA UNDER BASIC AND ADJUSTED POVERTY GUIDELINES, Category Under the Basic Under the Adjusted Increase in the Number of Federal Poverty Poverty Guideline Poor Jews between the Basic Guideline (100%) (150%) and Adjusted Guidelines People in Jewish 152, ,000 60% Households Jewish 66, ,000 54% Households Jewish Poverty in New York and the Nation Despite the fact that the 150% Adjusted Guideline is most relevant, there are, however, two circumstances in which it is useful to use the 100% Basic Guideline: when comparing the New York eight-county area poverty in Jewish households with the rest of the country, and when comparing it with local census data. Jewish poverty in the New York area needs to be seen in the context of the Jewish community in the United States as a whole. United Jewish Communities (UJC) recently sponsored a nationwide study of the American Jewish population, National Jewish Population Survey This report provides the only current national data on Jewish poverty. Comparing the national findings to those of UJA-Federation's Jewish Community Study of New York: 2002 shows that there are much higher levels of Jewish poverty in the New York area than in the nation as a whole.the UJC study estimated that there were 273,000 Jewishly engaged individuals who were in households with incomes below 100% of the federal guidelines, or about 5% of the study s estimate of the national Jewish population. By contrast, in the New York area, people living in Jewish households with incomes below the 100% federal guidelines account for 9% of the area's population in Jewish households, or nearly twice the Jewish poverty rate in the nation as a whole. Trends in New York-Area Jewish Poverty Compared to Overall National Trends Jewish poverty has increased substantially in the New York area during a decade when overall poverty levels in the nation have remained essentially stable.the number of people living in very poor Jewish households in the New York area measured by 100% of the Federal Poverty Guideline rose from a reported 77,500 in 1991 to 152,000 in 2002.This stands in sharp contrast to the situation in the nation as a whole, where the number of poor persons remained basically unchanged (at around 35 million people) over the same period. While there has been a substantial increase in Jewish poverty in New York City since 1991, about half of the reported increase is due to an improvement in an estimation method used in the 2002 study as compared with the 1991 study.this change is discussed in the Note on Methodology at the end of this report. Most of the real increase was due to the influx of a substantial number of refugees from the former Soviet Union during the decade of the 1990 s.the impact of the refugee influx on Jewish poverty in New York City is examined in Chapter Source: All 2002 poverty data for the eight-county New York area is based upon the Jewish Community Study of New York:
15 New York City s Poor Jews and Other Poor New Yorkers The U.S. Census of 2000 identified nearly 1.7 million people, more than one in every five New York City residents, as having incomes below the Federal Poverty Guideline.The more recent Current Population Survey data from the U.S. Bureau of Census found that in the year 2002 the proportion of people who were very poor included: 29% of all Hispanics 25% of all non-hispanic blacks 12% of all non-hispanic whites In this context, the Jewish population clearly has substantially lower levels of poverty than do the black and Hispanic populations. Since 13% of people in Jewish households are below the Basic (100%) Poverty Guideline, they have about the same level of poverty as do other non-hispanic whites in New York City. In terms of trends, while poverty in the Jewish community rose from a reported 7% of the people in Jewish households in 1991 to nearly 13% in 2002, the percentage of all New York City residents below the 100% poverty rate declined from 24.7% to 20.5% over a similar time frame. 3 Report Organization Chapter 2 includes an overview of Jewish poverty in the New York area and the suburban counties. Chapters 3 and 4 focus on what the 2002 study shows about the characteristics of poor people in Jewish households in New York City and its five boroughs.trends since the last Jewish population study in 1991 are examined, together with the reasons for the substantial increase in Jewish poverty in New York City during a period when overall poverty levels in New York have dropped slightly. Chapter 5 addresses the service needs of New York City s poor Jews and Chapter 6 discusses the problems of "near-poor" Jewish households in the New York area.the report concludes with A Note on Methodology which discusses issues central to this report on poverty. 3. Mark Levitan, Poverty in New York, 2002: One-Fifth of the City Lives Below the Federal Poverty Line, New York: Community Service Society, September 30, 2003, figure 4, page 4. 9
16 CHAPTER 2. JEWISH POVERTY IN THE NEW YORK AREA The Jewish Community Study of New York: 2002 examines Jewish life in the New York area New York City and the three suburban counties of Nassau, Suffolk, and Westchester. Among the study s principal findings is that 244,000 people 15% of the 1.66 million people living in Jewish households in the New York area are poor; that is, they live in households with incomes under 150% of the Federal Poverty Guideline. This is a substantially larger number of poor people than the 155,500 people in Jewish households who were identified as poor in the previous population study of New York s Jewish community in % of 1.55 million people. 1 Exhibit , NUMBER AND PERCENT OF PEOPLE IN POOR JEWISH HOUSEHOLDS IN THE EIGHT-COUNTY NEW YORK AREA Borough Number of People Number of People People in Poor Jewish Households or County in Poor Jewish in All Jewish as % of People in All Jewish Households Households Households in County Bronx 10,400 54,000 19% Brooklyn 156, ,000 30% Manhattan 12, ,000 4% Queens 42, ,000 19% Staten Island 3,900 52,000 8% NYC Total 226,000 1,134,000** 20% Nassau 4, ,000 2% Suffolk 7, ,000 6% Westchester 6, ,000 4% Suburban Total 18,000* 532,000* 3% Total, 8-County 244,000* 1,666,000 15% Area *Numbers may not add precisely due to rounding. ** Includes 972,000 Jewish people and 162,000 non-jewish persons living in New York City Jewish households. 1. While there has been a substantial increase in Jewish poverty since 1991, about half of the reported increase is due to an improvement in an estimation method used in the 2002 study as compared with the 1991 study. This change is discussed in the Note on Methodology at the end of this report. 11
17 Exhibit , NUMBER AND PERCENT OF PEOPLE IN POOR JEWISH HOUSEHOLDS IN THE EIGHT-COUNTY NEW YORK AREA Borough Number of People Number of People in Poor Jewish or County in Poor Jewish People in All Households as % of People in All Households Jewish Households Jewish Households in County Bronx 7,200 90,000 8% Brooklyn 101, ,000 26% Manhattan 14, ,000 4% Queens 19, ,000 7% Staten Island 3,200 37,000 9% NYC Total 145,000 1,117,000 13% Nassau 5, ,000 3% Suffolk 2, ,000 2% Westchester 2, ,000 2% Suburban Total 10, ,000 2% TOTAL 155,500* 1,554,000 10% *Numbers may not add precisely due to rounding. Source: 1991 New York Jewish Population Study Jewish Poverty 2002: City and Suburbs Poverty among Jewish households in the New York area is concentrated in New York City. Of the 244,000 people living in poor Jewish households, 226,000 (93%) live in New York City. In New York City, approximately 20% of all people in Jewish households are poor. In the three suburban counties, only 18,000 people a little over 3% of all people in Jewish households live in poor households. Suffolk has the largest number of people in poor Jewish households (8,000) and the highest percentage who are poor (6%) of the three suburbs in the New York area. Since 1991, there has been an increase in Jewish poverty in the suburbs at the same time that general Jewish population growth has occurred. On a numerical basis, there has been an increase in the number of people in poor Jewish households from 10,500 to 17,900 a 70% increase.yet, Jewish poverty is still minimal in the suburbs: in 1991, people in poor Jewish households represented 2% of all people living in Jewish households; by 2002, the percentage rose to only 3%. 12
18 CHAPTER 3. JEWISH POVERTY IN NEW YORK CITY IN 2002 This chapter focuses on Jewish poverty in New York City. Data analyses focus on the characteristics of poor persons living in Jewish households and provide insight into factors associated with the increase in Jewish poverty since Dimensions of Poverty There are three dimensions to Jewish poverty in the New York City Jewish community. 96,000 Poor Jewish Households 211,000 Poor Jews 226,000 People in Poor Jewish Households (including non-jews) The figure of 226,000 people living in poor Jewish households is the most useful measure of Jewish poverty in the city. Poverty is the result of low household income that affects all of the individuals who share that household and its income. Twenty percent of all people living in New York City Jewish households are poor.the sheer size of the poor population 226,000 people living in poor Jewish households represents more people than live in all but the four largest Jewish communities in the United States.There are as many poor people living in New York City Jewish households as there are people living in all Jewish households in Philadelphia or in Boston. Within New York City, poverty in the Jewish community is not equally distributed, but varies by age and gender, immigration status, household size, marital status, employment, education, and religious denomination. Poverty in the Jewish community is more prevalent among Orthodox households with large families, recent Russian-speaking immigrants, seniors (especially older women living alone), people who are unemployed (especially if they are disabled and unable to work), and people who do not have a college degree. Exhibit 3.1 summarizes the major poverty groups in the Jewish community in
19 Exhibit 3.1 GROUPS IN POVERTY, NEW YORK CITY JEWISH COMMUNITY, 2002 Number of Poor People % of All Poor People Larger Orthodox Households (4 or more people, all non-russian-speaking, and no one over 65) 60,000 27% Russian-speaking, under 65 52, Russian-speaking, over 65 48, Non-Russian-speaking, over 65 28, Others, including 36, People with a disability & unable to work Unemployed people People with less than a college education Total 226, % Age Distribution of the Jewish Poor Poverty in the Jewish community is not concentrated in any one age group, but is proportionately higher among seniors and children.thirty-five percent of the seniors in Jewish households (76,500 people 65 years or older) and more than 20% of the children and youth (52,300 people under 18) are poor. In absolute terms, the largest number of poor people in Jewish households 97,200 are working-age adults (between 18 and 64); however, only 15% of all working-age adults are poor. Reflecting the high percentage of seniors below the adjusted poverty guidelines, one in every three persons in poor Jewish households (34%) is 65 or older, while among all of the city s Jewish households, less than one in five persons (19%) is 65 or older. The lower portion of Exhibit 3.2 presents a more detailed picture of seniors by age. Among Jewish household seniors, age is not strongly related to the percentage which are poor; 36% of seniors ages 64-74, 36% of seniors ages 75-84, and 28% of seniors at least 85 years of age live in poor Jewish households.while there are relatively few poor seniors over the age of 85 only 9,100 this group is among the most vulnerable because they are both elderly and poor. 14
20 Exhibit 3.2 AGE DISTRIBUTION, PEOPLE IN POOR JEWISH HOUSEHOLDS, NEW YORK CITY, 2002 Age Groups Children (under 18) 254,200 52,300 21% 23% Working-Age Adults (18 64) 659,900 97,200 15% 43 Seniors (65+) 219,900 76,500 35% 34 Total, All Ages 1,134, , % Seniors by Age Total Number Total Number of Seniors People in Jewish Households Number of Poor Number of Poor Seniors % Poor of Total Number in Age Category % Poor of Total Seniors in Age Category % of All Poor by Age Category % of All Poor Seniors by Age Category ,700 35,800 36% 47% ,100 31,600 36% ,100 9,100 28% 12 Total Persons ,900 76, % Gender Distribution of the Jewish Poor Females outnumber males among the city s poor in Jewish households, as shown in Exhibit 3.3. Fifty-three percent of poor people in Jewish households are female precisely the same proportion as exists within the overall Jewish community of New York City. 15
21 Exhibit 3.3 GENDER DISTRIBUTION, PEOPLE IN POOR JEWISH HOUSEHOLDS, NEW YORK CITY, 2002 Number of Poor Persons Males Females Total Children and Youth (under 18) 24,300 28,000 52,300 Working Age (18 64) 49,300 47,600 96,900 Seniors (65+) 31,900 45,000 76,900 Total 105, , ,000* % of Total Children and Youth 46% % Working Age 51% % Seniors 41% % Total All People in Poor 47% % Jewish Households *Numbers may not add precisely due to rounding. The most marked age cohort disparity between males and females within the poor Jewish community is among the seniors. Of the seniors in poor Jewish households, 59% are women, while only 41% are men. This disparity seems likely to be due to three major factors: (1) within most American population groups, women tend to live longer than men; (2) men of this generation are more likely to have higher incomes from Social Security and other pensions due to longer working careers than are women; and (3) many older poor Jewish women live alone; this isolation adds to the difficulties already inherent in being poor. Marital Status Half of all respondents in Jewish households in New York City both poor and non-poor alike are married, as shown in Exhibit 3.4. However, one in every four poor Jewish household respondents (24%) is widowed, as compared to only 8% among all New York City survey respondents. Since most of the widowed are likely to be female and elderly, it is clear that being widowed is strongly correlated with poverty. Exhibit 3.4 MARITAL STATUS, RESPONDENTS IN POOR AND NON-POOR JEWISH HOUSEHOLDS, NEW YORK CITY, 2002 Survey Respondents Marital Status Poor Jewish Households Non-Poor Jewish Households Married 50% 50% Never Married Divorced or Separated Widowed 24 8 Total 100% 100%* *Percentages may not add precisely due to rounding. 16
22 Household Size The largest households (seven or more persons) are more likely to be poor (35%), than all households (21%); see Exhibit 3.5. More than 90% of the large poor households are Orthodox. Twenty-six percent of oneperson households are poor.two-thirds of these households consist of people above the age of 65.Within the 65 and older group living alone and in poverty, about half are women above the age of 75. Exhibit 3.5 PERCENT OF ALL JEWISH HOUSEHOLDS THAT ARE POOR BY HOUSEHOLD SIZE, NEW YORK CITY, 2002 Household Poor Jewish Jewish Households Size Households that Are Not Poor 1 Person 26% 74% 2 Persons 19% 81% 3 Persons 15% 85% 4 Persons 24% 76% 5 Persons 12% 88% 6 Persons 18% 82% 7+ Persons 35% 65% All Jewish 21% 79% Households New York City Russian-Speaking Households The 2002 UJA-Federation survey estimated that there are a total of 205,000 persons living in 87,000 Russian-speaking Jewish households in New York City. Most of these households include at least one adult who was born in the former Soviet Union (FSU); a minority of households include an adult who completed the survey interview in Russian, even though no adult was born in the FSU (most were born in Eastern Europe). Poverty is at a very high level among the Russian-speaking community nearly half of the people (49%) in the Russian-speaking Jewish community in New York City live in poor Jewish households.there is considerable evidence that this new New York community generally referred to in this report as "Russian-speaking" has begun to adapt to the American environment in the same manner as their Jewish immigrant predecessors of previous eras. But the conditions under which they arrived many penniless and few speaking English have required them to work hard to adapt to their new lives. In many cases, this has meant that their incomes are still below the poverty level. Especially important in this regard has been the fact that many of the refugees from the FSU were elderly and many were in ill health; these circumstances added immeasurably to their difficulties in escaping from poverty. 17
23 Exhibit 3.6 PEOPLE IN POOR AND NON-POOR RUSSIAN-SPEAKING JEWISH HOUSEHOLDS, NEW YORK CITY, 2002 Age People in Russian-speaking Jewish Households Poor Non-poor People in Poor Russian-speaking Jewish Households as % of People in All Russian-speaking Jewish Households Children and Youth 12% 20% 37% Young Adults (18 34) % Mature Adults (35 64) % Seniors % Total 100% 100% 49% (N=100,600) (N=104,600) The age profile of poor Russian-speaking Jewish households differs markedly from that of Russian-speaking Jewish households which are not poor. Some 20% of the people in non-poor Russian-speaking Jewish households are children versus 12% in poor Russian-speaking Jewish households.at the other extreme, only 8% of the people in non-poor Russian-speaking Jewish households are over age 65 versus 48% in poor Russianspeaking Jewish households. This means that 85% of the people in Russian-speaking households who are age 65 or older are poor. In sharp contrast, only 29% of Russian-speaking young adults in Jewish households are poor.this is a higher percentage than in the New York Jewish community in general (20%), but it is a clear indication of the success of younger Russian-speaking people in adapting to this country. It should also be noted that even in Russian-speaking households where the heads of households are in their 50 s or early 60 s, many of the issues associated with old age may be present such as poor health and an inability to work. 18
24 Employment and Occupational Status Not surprisingly, employment and occupation patterns in poor Jewish households differ from the patterns in Jewish households in general. Exhibit 3.7 shows that in New York City, nearly three out of five respondents to the survey and their spouses are employed. Only 27% of respondents and spouses in poor Jewish households are employed.among poor female respondents and spouses, only 20% are employed.the most frequent description of employment status for respondents and spouses in poor Jewish households was retired. Nearly half (45%) of all poor women are retired.this group seems likely to include many poor women who have very inadequate incomes to support themselves in their retirement.another 12% of the people in poor Jewish households describe themselves as disabled and unable to work.this is four times the percentage of disabled persons among all people in Jewish households. Exhibit 3.7 EMPLOYMENT AND STATUS OF POOR AND NON-POOR ADULTS IN JEWISH HOUSEHOLDS, NEW YORK CITY, 2002, AS PERCENT OF TOTAL All Adults Poor Adults Category All Adults Poor Adults Males Females Employed 57% 27% 35% 20% Unemployed Homemaker 7 6 <1 10 Student Retired Disabled Total 100% 100% 100% 100% * Note: Adults includes respondents and spouses only. Educational Attainment New York City s population in Jewish households is highly educated, as can be seen in Exhibit 3.8.The level of education among the poor is strikingly high. More than three in every five adults in poor Jewish households have attended college while more than 40% say that they have a bachelor s degree. It seems likely that this group of well-educated poor people includes many of the high number of Russian-speaking refugees from the former Soviet Union who moved to the city during the decade of the 1990s.At the same time, adults (respondents and spouses) in poor Jewish households are much more likely to have a high school diploma or less education than the non-poor (38% versus 16%). It also seems likely that recent immigrants are responsible for what appears to be a substantial improvement in the educational attainment of people in poor Jewish households in New York City since 1991 when the last comparable survey was done. During the 11-year period between the two surveys, the number of poor adults with a college degree or more rose sharply, from 25% in 1991 to 42% in 2002.This is a remarkable shift in such a short period of time. 19
25 Exhibit 3.8 EDUCATIONAL ATTAINMENT, POOR AND NON-POOR ADULTS IN JEWISH HOUSEHOLDS, NEW YORK CITY, 2002 Educational Attainment Adults in Poor Adults in Nonof Adults in Jewish Jewish Poor Jewish Households Households Households High School or less 38% 16% Some College College Degree Graduate Degree Total 100% 100% * Note: Adults includes respondents and spouses only. Religious Affiliation Higher percentages of poor respondents describe themselves as having no denominational affiliation ("just Jewish") or as either secular or as having no religion than is the case for the city's Jewish community as a whole. In all, two-fifths of respondents from poor households describe their status as being unaffiliated with any of the major denominations of Judaism. More than 80% of these poor non-denominational or secular households are Russian-speaking households. Earlier in this chapter (Exhibit 3.1) we noted that non-russian-speaking, non-senior, larger Orthodox households represented just over one-fourth (27%) of all people in poor New York City Jewish households, or 60,000 of the estimated 226,000 people living in poor Jewish New York City households. However, Orthodox Jewish household members are not disproportionately poor in comparison to all Jewish households. In fact, while 19% of all Jewish household survey respondents self-identified as Orthodox Jews, only slightly more (24%) poor Jewish household respondents self-identify as Orthodox (see Exhibit 3.9). The percentage of poor Conservative and Reform households, on the other hand, is substantially lower among poor Jewish households than is the case for the Jewish community of the city as a whole 33% versus 55%. And as was pointed out above, large households, typically Orthodox, are much more likely to be poor than smaller households. 20
26 Exhibit 3.9 RELIGIOUS AFFILIATION OF RESPONDENTS IN POOR AND NON-POOR JEWISH HOUSEHOLDS,NEW YORK CITY, 2002 Religious % of All Jewish % of Poor Jewish Affiliation Respondents Respondents Orthodox 19% 24% Conservative Reform Other Denominations 1 3 Nondenominational "Just Jewish" Secular and No Religion Total 100% 100% Change Since It is clear that there has been a substantial increase in the extent of Jewish poverty in New York City over the past decade. Jewish poverty in New York City has increased during a decade when overall poverty levels in the nation remained essentially stable and overall poverty levels in New York City declined. Three significant factors help explain why New York s Jewish poverty has increased: There has been a major increase in the number of Russian-speaking Jewish households in New York City, largely as a result of an influx of refugees fleeing dreadful living conditions in the former Soviet Union.Virtually all of these refugees were poor upon arrival. As the data presented in this chapter shows, many especially the younger and better educated of these Russian-speaking immigrants are no longer poor. Nearly one in every two Jewish refugees who left the former Soviet Union for the United States relocated to the New York region. For the most part, this resettlement took place through the efforts of HIAS (Hebrew Immigrant Aid Society) and NYANA (New York Association for New Americans), the Jewish voluntary agencies that administered a massive and successful federally supported program designed to assist Jewish families and individuals to move from terrible conditions of discrimination and deprivation to new opportunities in America. The presence of a substantial Russian-speaking population in New York was noted in Met Council s earlier report on Jewish poverty. It contained an estimate that as of 1991 there were already an estimated 75,000 Russian immigrants in the city and its suburbs. In addition, HIAS records indicate that more than 100,000 immigrants from the FSU were resettled in New York in the decade from 1991 to While there has been a substantial increase in Jewish poverty since 1991, about half of the reported increase is due to an improvement in an estimation method used in the 2002 study as compared with the 1991 study. This change is discussed in the Note on Methodology at the end of this report. 21
27 Exhibit 3.10 JEWISH REFUGEES FROM THE FORMER SOVIET UNION, Year U.S. Total N.Y.C. Total N.Y.C. as % of U.S. total ,853 14,937 42% ,379 21,512 46% ,325 18,488 51% ,339 16,413 49% ,010 10,917 50% ,088 8,950 45% ,219 6,072 40% ,054 3,248 40% ,500 2,586 34% ,920 2,475 36% Total, , ,598 46% Source: HIAS. A very large component of the Jewish poor consists of larger Orthodox non-russian-speaking households where no elderly persons are present. All together, 60,000 persons 27% of all persons in poor Jewish households are members of these poor larger Orthodox households. Their average household size is nearly seven persons (6.82), with roughly equal proportions of the households including 4 persons, 5-6 persons, 7-9 persons, and 10 persons or more. Almost all of these poor, larger Orthodox households (95%) reside in Brooklyn. Over one-third (38%) live in Williamsburg; 28% in Borough Park, 15% in Flatbush-Midwood, and 3% in Crown Heights. The poverty of these households is attributable, at least in part, to the substantial income needed to lift a household of seven persons above the Adjusted Poverty Guideline an annual income of more than $40,000 was required in Nearly two-thirds of the poor Orthodox households include an employed person (64%). Only 6% reported that the respondent was unemployed. There has been a significant shift in the relative numbers of the most vulnerable age groups among people living in poor Jewish households in New York City. The proportion of the population in poor Jewish households who are seniors has increased substantially in relation to the proportion of seniors among people in all Jewish households. The proportion of the elderly who lived in poor Jewish households in 2002 (35%) was substantially higher than the proportion of elderly who lived in all Jewish households (19%). A significant part of the expansion of the poor Jewish elderly population was due to the presence of a large proportion of elderly persons among the many Russian-speaking households identified in the 2002 survey. Many poor elderly Jews in Russian-speaking households and in other households are Nazi victims An estimated 27,500 Nazi victims live in poor Jewish households in the eight-county area. For a full discussion of this issue, please see The Special Report on Nazi Victims in the New York Area, 22
28 CHAPTER 4. THE GEOGRAPHIC DISTRIBUTION OF JEWISH POVERTY WITHIN NEW YORK CITY This chapter examines the geographic distribution of Jewish poverty within New York City on two levels: borough and neighborhood. The Jewish Community Study of New York: 2002 collected information on the zip codes of respondents to the survey. For analytic purposes, adjacent zip codes where most Jewish households live are grouped into the neighborhoods in the city with the largest concentrations of Jewish households. These clusters of neighborhoods are called Principal Jewish Areas. Obviously Jews live in other parts of the five boroughs as well, but not in sufficiently large numbers to present statistically valid information for any other particular neighborhood. Boroughs Jewish poverty in New York City in 2002 was unevenly distributed across the city s boroughs (see Exhibit 4.1). Of the five boroughs, Brooklyn has the most severe Jewish poverty. Brooklyn has the largest number of people (156,200) living in poor Jewish households, 69% of the citywide Jewish community poor.thirty percent of all people living in Brooklyn Jewish households are poor. Queens has the second highest number of people in poor Jewish households (42,700).The Bronx has a much smaller number of poor people (10,400) but 19% of all people living in Bronx Jewish households are poor (the same percentage as Queens). Manhattan has the third largest number of people in poor Jewish households, but only 4% of people in Manhattan Jewish households are poor. Staten Island has relatively few poor people in Jewish households (3,900). Exhibit 4.1 NUMBER AND PERCENT OF PEOPLE IN POOR JEWISH HOUSEHOLDS BY BOROUGH, NEW YORK CITY, 2002 Borough Number of People % of N.Y.C. Within Each Borough, % of in Poor Jewish Poor People in All People in Jewish Households Households Jewish Households Who are Poor Brooklyn 156,200 69% 30% Queens 42, % Bronx 10, % Manhattan 12, % Staten Island 3, % Total 226,000* 100%* 20% *See Exhibit 2.1 for the number of people in all Jewish Households. Numbers and percentages may not add precisely due to rounding. 23
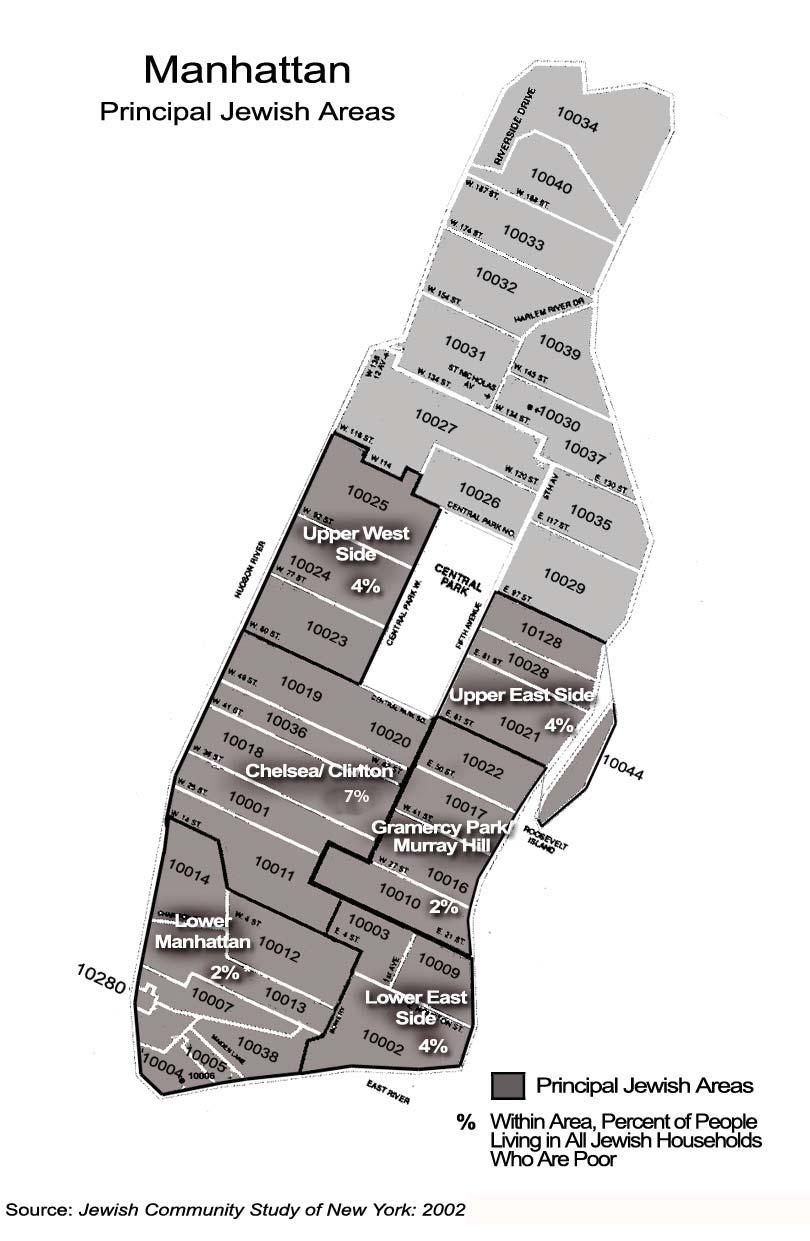
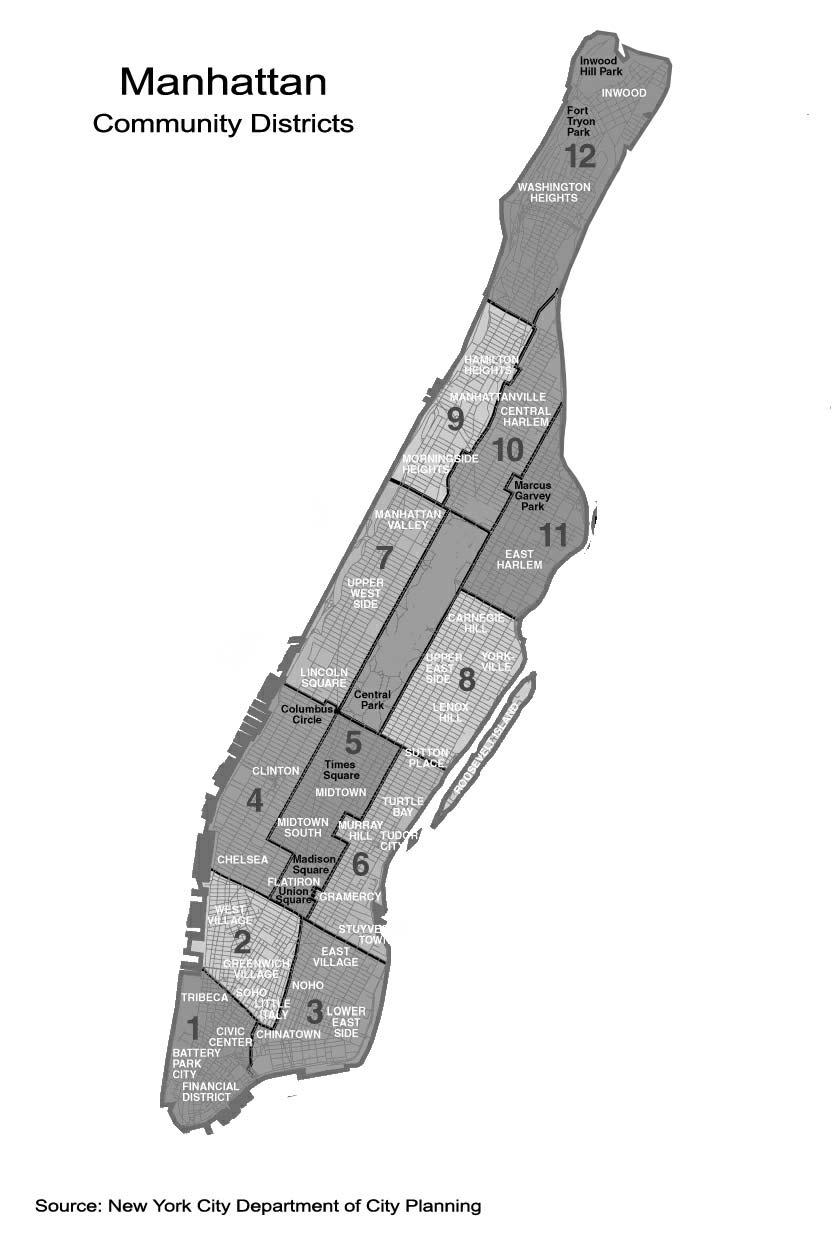
29 Principal Jewish Areas Exhibit 4.2 and the maps that follow in this section define 22 Principal Jewish Areas within New York City, based on the zip codes shown in the maps. These areas (collectively) include 82% of the total number of people living in Jewish households, as well as 83% of people in poor Jewish households. The second column from the left in Exhibit 4.2 identifies those community districts (CDs) that most closely correspond to each large Jewish neighborhood. New York City was divided into 59 CDs in the 1960's and they have since become widely accepted sub-borough divisions that are used as a basis for both citizen participation in city government and also as many municipal service delivery districts. The correspondence between CDs and Principal Jewish Areas is only approximate, because the boundaries of the CDs do not correspond exactly to those of the roughly 300 zip codes in New York City. There is a strikingly different pattern within the boroughs in terms of the extent to which poor Jewish households are concentrated within the Principal Jewish Areas or are located in areas outside the principal geographic areas. In Brooklyn, for example, only 7% of the people in poor Jewish households live outside the nine Principal Jewish Areas. In the Bronx, on the other hand, there is very little Jewish poverty within Riverdale/Kingsbridge, the largest Jewish area in the Bronx; thus, there is substantial Jewish poverty scattered throughout the remainder of the borough. Queens presents a mixed picture: Rego Park/Forest Hills and The Rockaways (including Far Rockaway) have substantial Jewish poverty; Fresh Meadows/Kew Gardens/Hillside has an average level; Northeast Queens has relatively little. There is also substantial Jewish poverty scattered throughout other areas in Queens. In Manhattan, none of the Principal Jewish Areas show high proportions of poverty. Poverty in the traditionally poor Jewish neighborhoods of Manhattan appears to have declined substantially since the 1993 Met Council report on Jewish poverty that identified the Lower East Side, Upper West Side, and Washington Heights as areas with considerable numbers of people in poor Jewish households. Today, while there undoubtedly are poor Jewish households in these areas, the number of poor Jewish households appears to have declined substantially. There appear to be no major concentrations of Jewish poverty left in Manhattan. In the discussion that follows, each borough is discussed in order of overall extent of poverty. 24
30 Exhibit 4.2* TOTAL NUMBER OF PEOPLE IN JEWISH HOUSEHOLDS, NUMBER AND PERCENT OF PEOPLE IN POOR JEWISH HOUSEHOLDS, BY PRINCIPAL JEWISH AREAS, NYC, 2002 Borough/Area Approximate Community Districts All People in Jewish Households* People in Poor Jewish Households Number* Percent* BROOKLYN Williamsburg 1 57,600 27,300 47% Brooklyn Heights/Park Slope 2 & 6 27,200 2,300 8% Crown Heights** 8 & 9 21,600 3,500 **16% Borough Park 12 82,600 25,000 30% Canarsie/Flatlands 18 42,900 9,800 23% Bensonhurst/Gravesend 11 44,500 21,100 47% Kingsbay/Madison 15 36,200 9,800 27% Coney Island/Brighton/Sheepshead Bay 13, part of 15 54,500 21,100 39% Flatbush/Midwood/Kensington 14, part of ,800 25,300 23% Remainder of Brooklyn 41,100 11,000 27% BROOKLYN TOTAL 516, ,200 30% QUEENS Rego Park/Forest Hills 6 42,500 11,600 27% Fresh Meadows/Kew Gardens/Hillside 8 31,000 5,100 16% Northeast Queens 11 28,200 1,400 5% The Rockaways 14 12,000 3,900 32% Remainder of Queens 106,300 20,700 19% QUEENS TOTAL 220,000 42,700 19% BRONX Kingsbridge/Riverdale 8 23,900 1,800 7% Northeast (includes Pelham Parkway and Parts of: 10, 15,900 5,100 32% Co-op City) 11,12 Remainder of The Bronx** 14,200 3,500 **25% BRONX TOTAL 54,000 10,400 19% MANHATTAN Lower Manhattan 1 & 2 21, % Lower East Side 3 31,300 1,300 4% Chelsea/Clinton 4 31,100 2,300 7% Gramercy Park/Murray Hill 6 37, % Upper West Side 7 71,800 3,100 4% Upper East Side 8 73,300 3,000 4% Remainder of Manhattan 25,400 1,900 7% MANHATTAN TOTAL 292,000 12,800 4% STATEN ISLAND Mid-Staten Island 2 & 3 34,000 2,900 9% Remainder of Staten Island 1 18,000 1,000 6% STATEN ISLAND TOTAL 52,000 3,900 8% NYC TOTAL 1,134, ,000 20% *Data in Exhibit 4.2 have been revised after the initial release of the Report on Jewish Poverty to reflect some additional assignment and re-assignment of zip code data to geographic sub-areas for the Jewish Community Study of New York, 2002: Geographic Profile, published in June All numbers have been rounded in order to simplify presentation, but percentage calculations were based on numbers prior to rounding. Please note that remainder totals have been modified slightly as needed to adjust for rounding in presentation to make data consistent with earlier tables. **Significantly fewer than 50 interviews in sub-area; caution is advised in interpretation of extent of poverty among Jewish household members. 25
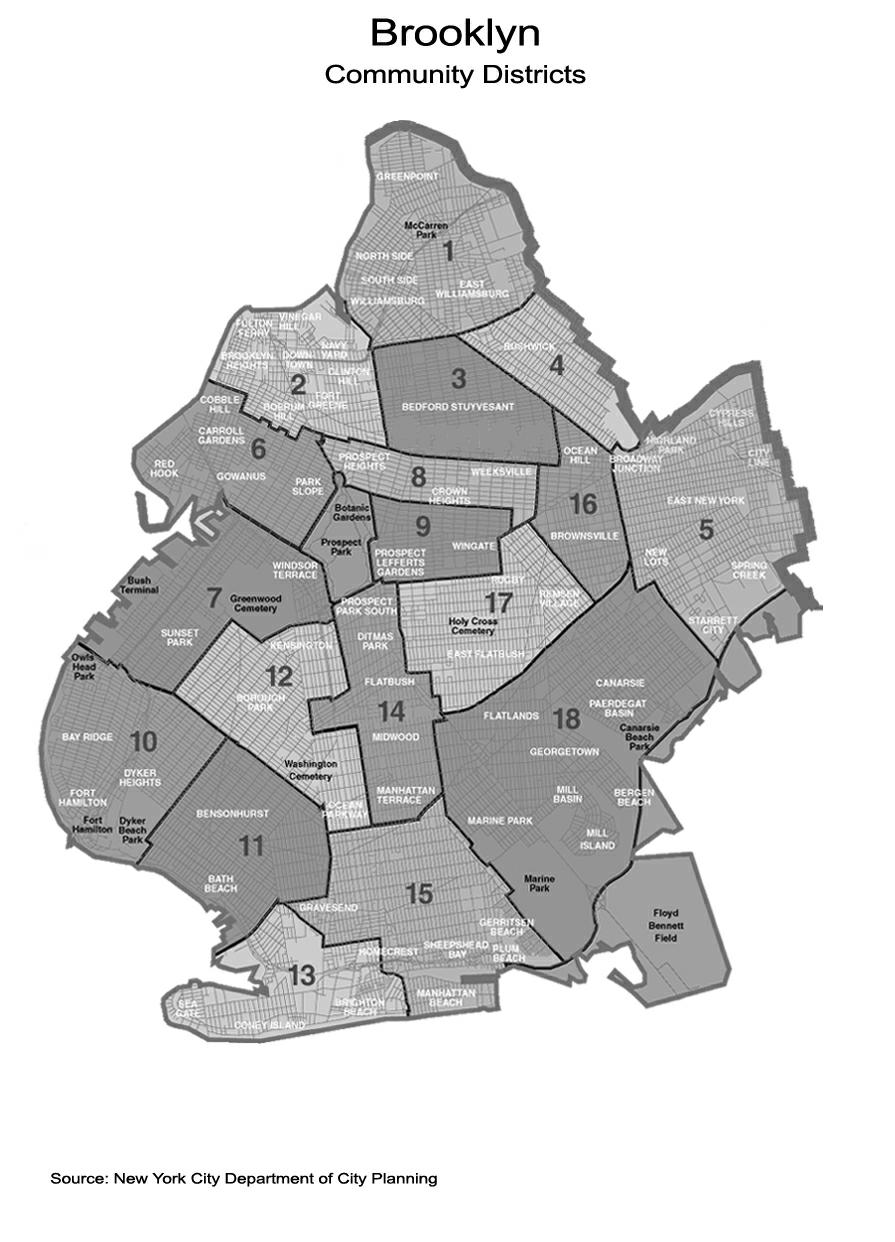
31 JEWISH POVERTY IN BROOKLYN Brooklyn the borough where nearly half (46%) of all people in city Jewish households live is the home of nearly seven out of every 10 poor people in Jewish households in New York City (69%). The highest concentrations of Jewish poverty in the entire city are in Williamsburg and Bensonhurst/ Gravesend where about half of all people in Jewish households are members of poor households. No other areas of the city even come close to having as high a proportion of households and people that are poor. Williamsburg also has the largest number of people in poor Jewish households an estimated 27,300 individuals of any of the city s Jewish neighborhoods. Nearly all of the Principal Jewish Areas in Brooklyn contain above-average concentrations of Jewish poverty: Bensonhurst/Gravesend (47%); Coney Island/Brighton/Sheepshead Bay (39%); Borough Park (30%); and Canarsie-Flatlands (23%). Even some Brooklyn areas often viewed as middle class contain substantial poor Jewish populations: Flatbush/Midwood/Kensington has 25,000 people in poor Jewish households, while Kings Bay/Madison has almost 10,000. All of these Principal Jewish Areas were also identified as principal areas of Jewish poverty in the 1993 poverty report published by Met Council. Very few of the people in poor Jewish households in Brooklyn (approximately 7%) live outside the nine Principal Jewish Areas in the borough. Thus, the residential patterns of Brooklyn s poor Jewish households appear to be much the same as those for all Jewish households. Age, Gender, and Marital Status. A majority of Brooklyn's Jewish seniors (56%) are poor. However, the borough is also home to 45,600 poor children and youth under the age of 18 in Jewish households. These 45,600 poor children in Jewish Brooklyn households represent 87% of all children under 18 years of age in poor Jewish households in New York City. A substantial majority of the poor Jews in Brooklyn are women (55%). This is probably due in large measure to the advanced age of many of Brooklyn's Jewish poor. Three out of every five of Brooklyn's poor adult Jews are married (59%) and a substantial proportion of the borough's Jewish poor are widowed (21%). People who have never married or are divorced or separated account for one in five (20%) poor Brooklyn Jewish adults. Employment and Occupation. Jewish poverty in Brooklyn is severely impacted by the fact that only 30% of the poor respondents (and their spouses, if any) to the UJA-Federation survey reported that they were employed. Another 9% report that they are unemployed. Some 38% of Brooklyn's poor Jews, or about 42,000 persons, describe themselves as retired. Another 12% are disabled. In all, the disabled and retired account for half of the potential labor force of poor Jews in the borough. The Russian-Speaking Population. Brooklyn is where most of New York City's Russian-speaking Jewish households live, largely as a result of the substantial resettlement there of refugees from the former Soviet Union. Poverty is severe among this population. Just over half (52%) of the members of Jewish Russianspeaking households in Brooklyn live in households that report incomes below the Adjusted Poverty Guideline for As a result, of the 156,200 estimated persons in poor Jewish households in Brooklyn, just under half (45%) 70,600 people live in Russian-speaking Jewish households. 26
32 Exhibit 4.3 SELECTED DATA FOR BROOKLYN Households All Jewish Poor Jewish Poor Jewish Households Households Households as % of all Jewish Households Number of Households, ,000 30,600 22% Number of Households, ,000 59,800 35% % Change, * 21% 95% Average Household Size, People People in People in People in Poor Jewish all Jewish Poor Jewish Households as % of People Number of People in Households Households in all Jewish Households Jewish Households , ,200 26% , ,200 30% % Change, % 54% Age Groups Number of Children (under 18) 155,500 45,600 29% Number of Adults (18 64) 273,600 62,100 23% Number of Elderly (65+) 86,900 48,500 56% Gender Groups Males 247,700 70,800 29% Females 268,300 85,400 32% Russian-Speakers Persons in Russian-speaking 136,100 70,600 52% households Marital Status (Respondents) Married 61% 59% Never married 16% 9% Divorced or Separated 10% 11% Widowed 14% 21% Employment Status (Respondents and Spouses) Employed 52% 30% Unemployed 7% 9% Homemaker 9% 6% Student 4% 5% Retired 24% 38% Disabled 4% 12% Sources: 1991 data is from the UJA-Federation of New York s 1991 New York Jewish Population Study. All other data is from the Jewish Community Study of New York: *As noted in the introduction to this report, the size of the increase is due in part to an improvement in the estimation method used in the 2002 study as compared with the 1991 study. This change is discussed in the Note on Methodology to this report. 27
33 28
34 29
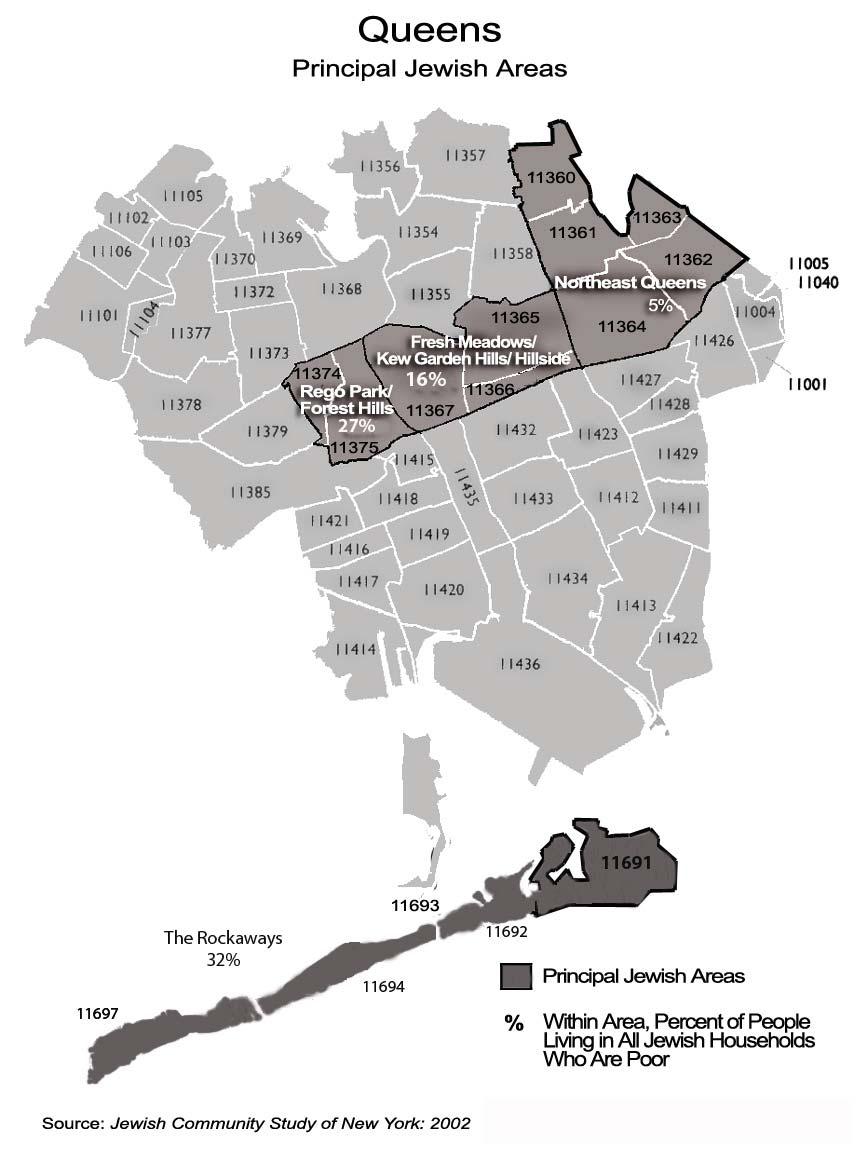
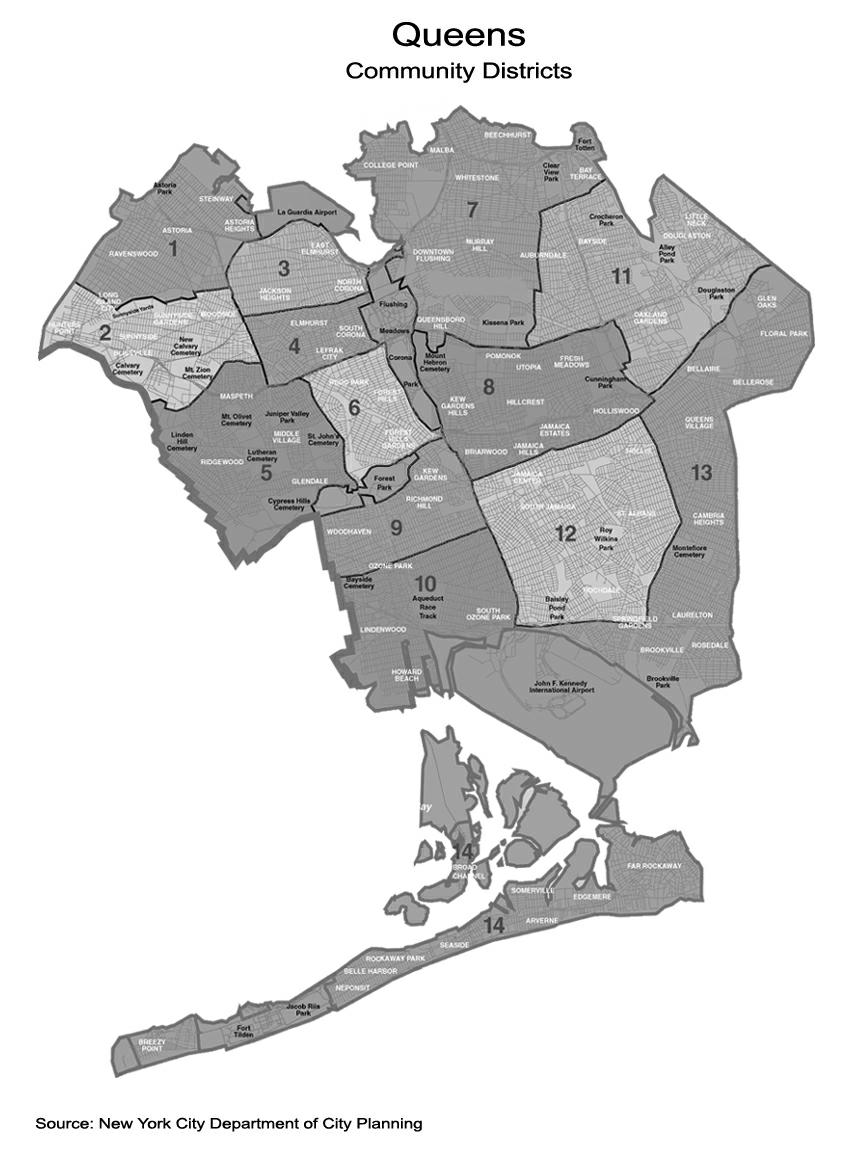
35 JEWISH POVERTY IN QUEENS About one in five people living in all Jewish households in New York City live in the Borough of Queens. Essentially the same proportion exists for poor people in Jewish households just under one in five of the Jewish poor in New York City live in Queens. The largest concentration of poverty in Queens is in Rego Park/Forest Hills with 11,600 people. Fresh Meadows/Kew Gardens/Hillside has 5,100 people living in poor Jewish households. The Rockaways, including Far Rockaway, have a very high percentage of poor people 32%. Within the Far Rockaway zip code, just over 50% of all people in Jewish households live below the adjusted povery level. But a relatively moderate absolute number: 3,900 people live in poor Rockaway Jewish households. Northeast Queens contains few poor people within this large Jewish community. All of these large Jewish neighborhoods combined account for over half of the Jewish poverty in Queens. There are clearly significant pockets of Jewish poverty outside the largest Jewish neighborhoods in such areas as Jackson Heights, Flushing, and Howard Beach. Age, Gender, and Marital Status. The residents of Queens in poor Jewish households include substantial numbers of children and youth, as well as persons of working age, although 44% of poor people in Jewish Queens are aged 65 or older. Women outnumber men by a modest percentage (52% to 48%). As befits this family-oriented borough, nearly half of all poor Jewish respondents to the survey are married and another third are widowed. Only one-tenth of the poor adult Jews in Queens reported themselves as never having married, while another tenth said they were divorced or separated. Employment and Occupation. There is a substantial number of working-age people in poor Jewish households in Queens: 18,200 persons are between the ages of 18 and 64 (43% of the Jewish poverty in the borough). However, only 13% of these poor adults were employed in More than half of the poor adults in the Jewish community in Queens described themselves as retired. This suggests that there may be opportunities for programs that offer work and training opportunities as well as a need for service and income support assistance in the Queens Jewish community. The Russian-Speaking Population. The total Russian-speaking population of Queens grew rapidly in the period, expanding from a small base to one fifth of the entire Jewish community of the borough. A very large fraction of this Russian-speaking population (56%) lives in households with incomes below the Adjusted Poverty Guideline. Queens is home to the largest proportion of the City s Bukharan Jewish population. 30
36 Exhibit 4.4 SELECTED DATA FOR QUEENS Households All Jewish Poor Jewish Poor Jewish Households Households Households as % of all Jewish Households Number of Households, ,000 8,500 8% Number of Households, ,000 19,900 23% % Change, * -22% 134% Average Household Size, People People in People in People in Poor Jewish all Jewish Poor Jewish Households as % of People Number of People in Jewish Households 1991 Households 258,000 Households 19,000 in all Jewish Households 7% ,000 42,700 19% % Change, % 125% Age Groups Number of Children (under 18) 52,000 5,500 11% Number of Adults (18 64) 113,100 18,200 16% Number of Elderly (65+) 54,900 19,000 35% Gender Groups Males 102,100 20,400 20% Females 117,900 22,300 19% Russian-Speakers Persons in Russian-speaking 44,500 24,900 56% households Marital Status (Respondents) Married 51% 48% Never married 18% 10% Divorced or Separated 11% 10% Widowed 22% 32% Employment Status (Respondents and Spouses) Employed 48% 13% Unemployed 5% 3% Homemaker 5% 5% Student 4% 9% Retired 35% 56% Disabled 3% 14% Sources: 1991 data is from the UJA-Federation of New York s 1991 New York Jewish Population Study. All other data is from the Jewish Community Study of New York: *As noted in the introduction to this report, the size of the increase is due in part to an improvement in the estimation method used in the 2002 study as compared with the 1991 study. This change is discussed in the Note on Methodology to this report. 31
37 32
38 33
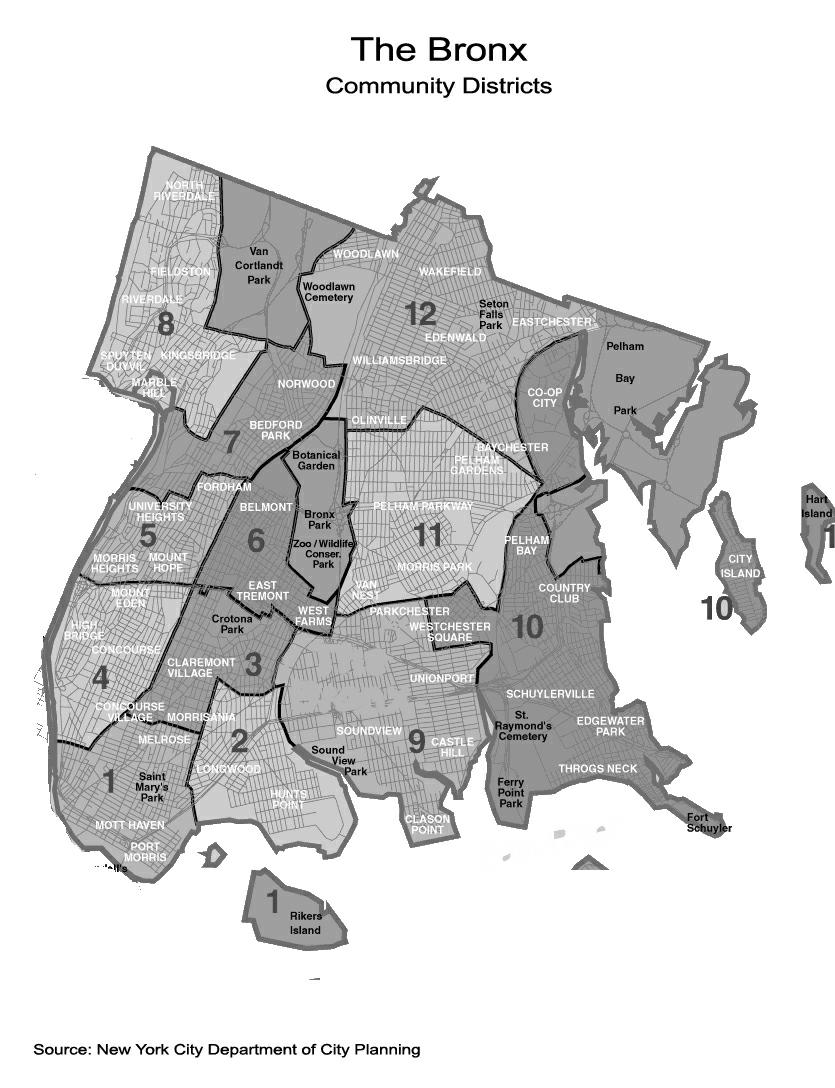
39 JEWISH POVERTY IN THE BRONX Poor Jewish households account for 22% of all Bronx Jewish households and 19% of all individuals in Bronx Jewish households. The average household size of poor Jewish households has fallen to less than two persons (1.93), lower than in any of the boroughs except Manhattan. In the Bronx, there is very little Jewish poverty in Riverdale/Kingsbridge, the borough s largest Jewish neighborhood. The Northeast Bronx, including Pelham Parkway and Co-op City, has an estimated 5,100 poor people in Jewish households. While there are substantial numbers of poor Jewish households living in the remainder of the borough, they appear to be in widely scattered locations. One out of four persons in Jewish households in these less concentrated areas are members of a poor Jewish household. Areas such as Parkchester and Fordham have substantial numbers of poor Jewish households. These poor households comprise most of the Jewish households left in the borough, although they are no longer concentrated in particular neighborhoods. Age, Gender, and Marital Status. The greatest increase in the Jewish poverty population in the Bronx has been among the poor, aged 65 and over, who now account for about one in every three poor people in Bronx Jewish households. Children and youth (under age 18) represent less than one-tenth of the borough's Jewish poverty population. Women, who tend to live to greater ages than men, represent 55% of Jewish poverty in the Bronx. Only one in five poor Bronx adults in Jewish households is married, a lower ratio than in any borough except Manhattan. More than one in three is widowed, a statistic consistent with the significant number of poor older women. Employment and Occupation. One in every seven poor adults in Jewish households in the Bronx is employed, while almost half are retired. This is consistent with the age structure of the poor Jewish community in the borough and suggests that services and income supports, rather than training and employment programs, are most likely to have positive effect on the poor Jewish community of the borough. The Russian-Speaking Population. The Bronx did not see a significant increase in its Russianspeaking Jewish community during the major period of immigration in the 1990's. The borough's relatively small group of Russian-speaking households is severely afflicted by problems of poverty; 43% of people in Bronx Russian-speaking Jewish households are poor. 34
40 Exhibit 4.5 SELECTED DATA FOR THE BRONX Households All Jewish Poor Jewish Poor Jewish Households Households Households as % of all Jewish Households Number of Households, ,000 3,400 8% Number of Households, ,000 5,400 22% % Change, * -40% 59% Average Household Size, People People in People in People in Poor Jewish all Jewish Poor Jewish Households as % of People Number of People in Jewish Households 1991 Households 90,000 Households 7,200 in all Jewish Households 8% ,000 10,400 19% % Change, % 44% Age Groups Number of Children (under 18) 6, % Number of Adults (18 64) 33,200 6,100 18% Number of Elderly (65+) 14,300 3,600 25% Gender Groups Males 26,100 4,700 18% Females 27,900 5,700 20% Russian-Speakers Persons in Russian-speaking 3,700 1,600 43% households Marital Status (Respondents) Married 38% 20% Never married 23% 25% Divorced or Separated 15% 18% Widowed 24% 37% Employment Status (Respondents and Spouses) Employed 49% 15% Unemployed 4% 9% Homemaker 6% 4% Student 3% 5% Retired 35% 45% Disabled 4% 22% Sources: 1991 data is from the UJA-Federation of New York s 1991 New York Jewish Population Study. All other data is from the Jewish Community Study of New York: *As noted in the introduction to this report, the size of the increase is due in part to an improvement in the estimation method used in the 2002 study as compared with the 1991 study. This change is discussed in the Note on Methodology to this report. 35
41 36
42 37
43 JEWISH POVERTY IN MANHATTAN Manhattan is home to 26% of the city s people in Jewish households but only 6% of the poor. Only 4% of the borough s people in Jewish households are poor. Yet, because the Jewish population is so large, even a low percentage means there are nearly 13,000 people in poor Jewish households. Jewish poverty in the traditional poor Jewish neighborhoods of Manhattan appears to have declined substantially since the 1993 Met Council report on Jewish poverty. The 1993 study identified the Lower East Side, Upper West Side, and Washington Heights as areas of substantial numbers of people in poor Jewish households. Today, while there undoubtedly are poor Jewish households in these areas, the number of poor Jewish households appears to have declined considerably. There do not appear to be any major geographic concentrations of Jewish poverty left in Manhattan. This does not mean that there are not any poor Jews left in traditionally poor Jewish neighborhoods such as the Lower East Side, but only that their numbers do not appear to be substantial. Gentrification in these neighborhoods has apparently meant that as older poorer Jews have died or moved into long-term care facilities, they have been replaced by people who are not poor and, in some cases, not Jewish. Age, Gender, and Marital Status. There are very few children in poor Jewish households in Manhattan. Based on responses to the survey, less than 1% of the children in Jewish households in the borough are poor. In general, Jewish poverty is relatively low in Manhattan. Even among the elderly, only 8% of Jews over the age of 65 are poor, well below the citywide average. Manhattan's people in poor Jewish households are predominantly male, in contrast to the situation in all of the other major boroughs where women outnumber men among the poor. Only 12% of the poor respondents to the survey are currently married, and a substantial majority (57%) report that they have never been married. One in five are widowed. Employment and Occupation. Consistent with the fact that many of Manhattan's Jewish community s poor are unmarried people of working age, 43% are employed and another 14% report themselves as unemployed and presumably seeking work. This is a much higher percentage of employed poor persons than in any other borough and also indicates that most poor in Manhattan are in the active labor force. The borough would appear to offer good prospects for job training and placement services. The Russian-Speaking Population. Manhattan has not attracted many recent immigrants from the FSU, as indicated by the modest size of its total Russian-speaking population. Also, far fewer of Manhattan's small Russian-speaking Jewish community are poor than is the case in any other borough. The high cost of housing in Manhattan has probably played a significant role in obstructing the resettlement of Russian-speaking households in the borough. 38
44 Exhibit 4.6 SELECTED DATA FOR MANHATTAN Households All Jewish Poor Jewish Poor Jewish Households Households Households as % of all Jewish Households Number of Households, ,000 7,600 4% Number of Households, ,000 9,200 6% % Change, * -15% 21% Average Household Size, People People in People in People in Poor Jewish all Jewish Poor Jewish Households as % of People Number of People in Jewish Households 1991 Households 338,000 Households 14,400 in all Jewish Households 4% ,000 12,800 4% % Change, % -11% Age Groups Number of Children (under 18) 29, % Number of Adults (18 64) 203,100 7,900 4% Number of Elderly (65+) 59,500 4,700 8% Gender Groups Males 132,300 7,100 5% Females 159,700 5,700 4% Russian-Speakers Persons in Russian-speaking 9,300 1,500 16% households Marital Status (Respondents) Married 40% 12% Never married 35% 57% Divorced or Separated 17% 10% Widowed 8% 21% Employment Status (Respondents and Spouses) Employed 68% 43% Unemployed 7% 14% Homemaker 5% 0% Student 2% 8% Retired 19% 36% Disabled 21% 0% Sources: 1991 data is from the UJA-Federation of New York s 1991 New York Jewish Population Study. All other data is from the Jewish Community Study of New York: *As noted in the introduction to this report, the size of the increase is due in part to an improvement in the estimation method used in the 2002 study as compared with the 1991 study. This change is discussed in the Note on Methodology to this report. 39
45 40
46 41
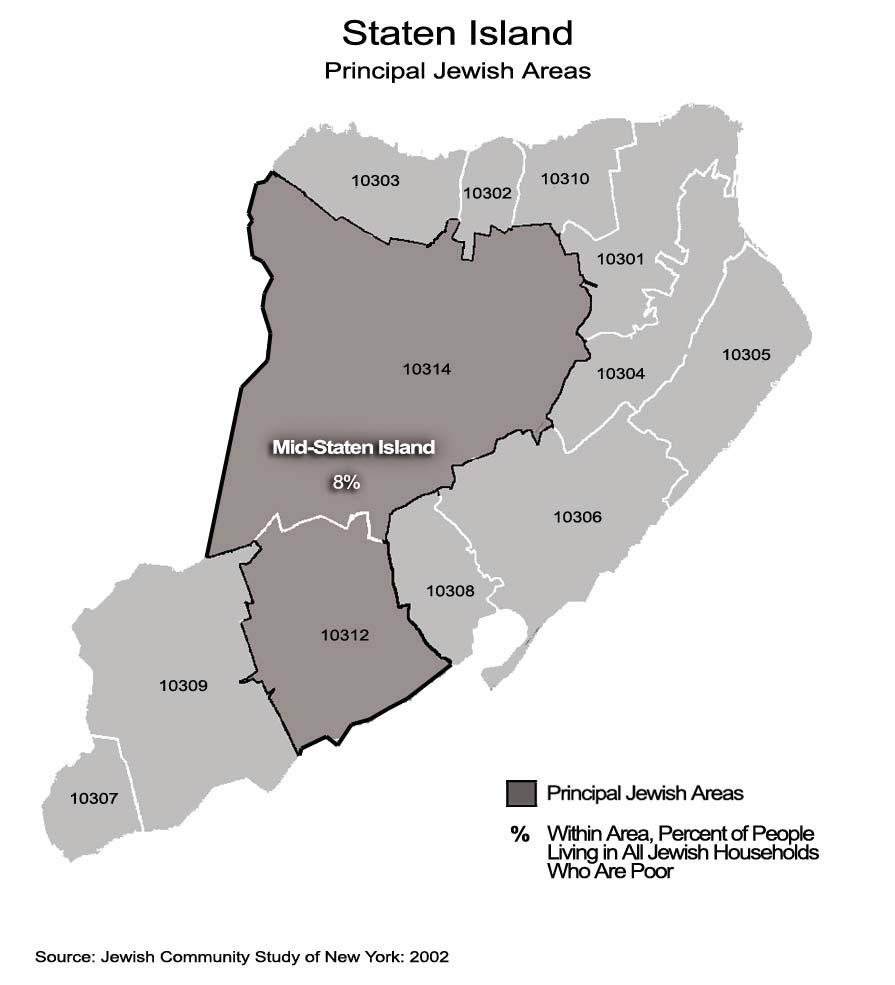
47 JEWISH POVERTY IN STATEN ISLAND Exhibit 4.7 indicates that Staten Island is the borough where the overall Jewish community has grown the fastest since 1991: 64% growth in the number of households and a 41% growth in the total number of people in Staten Island Jewish households. In 2002, the percent of Staten Island's Jewish community that falls below the Adjusted Poverty Guideline (8%) is lower than in any of the other boroughs except Manhattan. Age and Gender. Most of the low-income Jewish household residents in Staten Island are between the ages of 18 and 64, the prime working ages, and a substantial majority is male (59% men versus 41% women). The size of the sample of respondents from Staten Island was too small to provide reliable information on the marital status of the borough's poor Jews. However, the relatively large average size of Staten Island's poor Jewish households suggests that most of the adults are married. The Russian-Speaking Population. At present, Staten Island has only a modest number of Russianspeaking Jews, and the relationship of Russian-speaking status and poverty is fascinating. While only 22% of the people in the borough s Jewish households are Russian-speaking, Russian-speaking households account for over half (51%) of all Jewish poverty in Staten Island. Despite this apparent disproportionate poverty status, only 18% of all members of Staten Island Russian-speaking Jewish households are below the adjusted poverty guideline, a very low proportion compared to Brooklyn, the Bronx, and Queens, but very similar to Manhattan. 42
48 Exhibit 4.7 SELECTED DATA FOR STATEN ISLAND Households All Jewish Poor Jewish Poor Jewish Households Households Households as % of all Jewish Households Number of Households, ,000 1,000 9% Number of Households, ,000 1,700 9% % Change, * 64% 70% Average Household Size, People People in People in People in Poor Jewish all Jewish Poor Jewish Households as % of People Number of People in Jewish Households 1991 Households 37,000 Households 3,200 in all Jewish Households 9% ,000 3,900 8% % Change, % 22% Age Groups Number of Children (under 18) 10, % Number of Adults (18 64) 36,900 2,900 8% Number of Elderly (65+) 4, % Gender Groups Males 27,500 2,300 8% Females 24,500 1,600 6% Russian-Speakers Persons in Russian-speaking 11,400 2,000 18% households Sources: 1991 data is from the UJA-Federation of New York s 1991 New York Jewish Population Study. All other data is from the Jewish Community Study of New York: *As noted in the introduction to this report, the size of the increase is due in part to an improvement in the estimation method used in the 2002 study as compared with the 1991 study. This change is discussed in the Note on Methodology to this report. In general, the low percentage of poor Jewish households resulted in a minimal number of interviews with poor Jewish households. While the estimate of the number of Jewish households that are poor is based on a sufficiently large enough base of households, our ability to make estimates of the characteristics of the poor was limited. Therefore, data for Staten Island on marital status and employment is not reported. 43
49 44
Multiple Streams: Diversity Within the Orthodox Jewish Community in the New York Area
 Multiple Streams: Diversity Within the Orthodox Jewish Community in the New York Area Jacob B. Ukeles, Ph.D. December 17, 2012 Association for Jewish Studies 44th Annual Conference Outline 2 Introduction
South-Central Westchester Sound Shore Communities River Towns North-Central and Northwestern Westchester
 CHAPTER 9 WESTCHESTER South-Central Westchester Sound Shore Communities River Towns North-Central and Northwestern Westchester WESTCHESTER 342 WESTCHESTER 343 Exhibit 42: Westchester: Population and Household
The Jewish Community Study of New York: 2002 GEOGRAPHIC PROFILE
 The Jewish Community Study of New York: 2002 GEOGRAPHIC PROFILE June 2004 UJA-FEDERATION LEADERSHIP President Larry Zicklin* Chair of the Board Morris W. Offit* Executive Vice President & CEO John S. Ruskay
JEWISH COMMUNITY STUDY OF NEW YORK: 2011 COMPREHENSIVE REPORT. Overview
 JEWISH COMMUNITY STUDY OF NEW YORK: 2011 COMPREHENSIVE REPORT Overview 1 THE RESEARCH TEAM Jewish Policy and Action Research (JPAR) Comprehensive Report Authors Steven M. Cohen, Ph.D., Research Team Director
JEWISH COMMUNITY STUDY OF NEW YORK: 2011 SPECIAL REPORT ON POVERTY
 JEWISH COMMUNITY STUDY OF NEW YORK: 2011 SPECIAL REPORT ON POVERTY Community Briefing June 12, 2013 Tweeting encouraged using hashtag #JCSNY. Presentation by Jacob B. Ukeles, Ph.D. In Consultation With
January Parish Life Survey. Saint Paul Parish Macomb, Illinois
 January 2018 Parish Life Survey Saint Paul Parish Macomb, Illinois Center for Applied Research in the Apostolate Georgetown University Washington, DC Parish Life Survey Saint Paul Parish Macomb, Illinois
The Changing Jewish Community: Considerations for Reform Congregations in Long Island and Queens
 The Changing Jewish Community: Considerations for Reform Congregations in Long Island and Queens Based upon data from the Jewish Community Study of New York: 2002 Jennifer Rosenberg UJA-Federation of New
Conservative Judaism A Sociodemographic Overview of Conservative Jewry in the Metropolitan New York Area David M. Pollock Jewish Community Relations
 Conservative Judaism A Sociodemographic Overview of Conservative Jewry in the Metropolitan New York Area David M. Pollock Community Relations Council of New York Data sources National data are from the
ABOUT THE STUDY Study Goals
 ABOUT THE STUDY ABOUT THE STUDY 2014 Study Goals 1. Provide a database to inform policy and planning decisions in the St. Louis Jewish community. 2. Estimate the number of Jewish persons and Jewish households
JEWISH EDUCATIONAL BACKGROUND: TRENDS AND VARIATIONS AMONG TODAY S JEWISH ADULTS
 JEWISH EDUCATIONAL BACKGROUND: TRENDS AND VARIATIONS AMONG TODAY S JEWISH ADULTS Steven M. Cohen The Hebrew University of Jerusalem Senior Research Consultant, UJC United Jewish Communities Report Series
August Parish Life Survey. Saint Benedict Parish Johnstown, Pennsylvania
 August 2018 Parish Life Survey Saint Benedict Parish Johnstown, Pennsylvania Center for Applied Research in the Apostolate Georgetown University Washington, DC Parish Life Survey Saint Benedict Parish
Survey Report New Hope Church: Attitudes and Opinions of the People in the Pews
 Survey Report New Hope Church: Attitudes and Opinions of the People in the Pews By Monte Sahlin May 2007 Introduction A survey of attenders at New Hope Church was conducted early in 2007 at the request
May Parish Life Survey. St. Mary of the Knobs Floyds Knobs, Indiana
 May 2013 Parish Life Survey St. Mary of the Knobs Floyds Knobs, Indiana Center for Applied Research in the Apostolate Georgetown University Washington, DC Parish Life Survey St. Mary of the Knobs Floyds
FACTS About Non-Seminary-Trained Pastors Marjorie H. Royle, Ph.D. Clay Pots Research April, 2011
 FACTS About Non-Seminary-Trained Pastors Marjorie H. Royle, Ph.D. Clay Pots Research April, 2011 This report is one of a series summarizing the findings of two major interdenominational and interfaith
Hispanic Members of the Presbyterian Church (U.S.A.): Survey Results
: Survey Results") Hispanic Members of the Presbyterian Church (U.S.A.): Survey Results Teresa Chávez Sauceda May 1999 Research Services A Ministry of the General Assembly Council Presbyterian Church (U.S.A.) 100 Witherspoon
Hispanic Members of the Presbyterian Church (U.S.A.): Survey Results Teresa Chávez Sauceda May 1999 Research Services A Ministry of the General Assembly Council Presbyterian Church (U.S.A.) 100 Witherspoon
Britain s Jewish Community Statistics 2010
 Britain s Jewish Community Statistics 2010 Daniel Vulkan Board of Deputies of British Jews April 2012 Contents Executive summary... 3 Introduction... 5 Births... 6 Marriages... 9 Divorces... 13 Deaths...
Jewish Community Study
 1 The 2008 Greater Middlesex Jewish Community Study Ira M. Sheskin, Ph.D. Director of the Jewish Demography Project of the Sue and Leonard Miller Center for Contemporary Judaic Studies and Associate Professor,
The best estimate places the number of Catholics in the Diocese of Trenton between 673,510 and 773,998.
 Number of Catholics Living in the Diocese of Trenton It is impossible to verify how many individual Catholics reside in the Diocese of Trenton. Not all are registered in parishes, and the U.S. Census does
INTRODUCTION. Vital-ARe-We-4.pdf, or by ing
 INTRODUCTION FACTS about Local and Global Mission Programs and Giving A Report of UCC Results from the FACT Study Marjorie H. Royle, Ph.D. Clay Pots Research November, 2011 This report is one in a series
Council on American-Islamic Relations RESEARCH CENTER AMERICAN PUBLIC OPINION ABOUT ISLAM AND MUSLIMS
 CAIR Council on American-Islamic Relations RESEARCH CENTER AMERICAN PUBLIC OPINION ABOUT ISLAM AND MUSLIMS 2006 453 New Jersey Avenue, SE Washington, DC 20003-2604 Tel: 202-488-8787 Fax: 202-488-0833 Web:
A Comprehensive Study of The Frum Community of Greater Montreal
 A Comprehensive Study of The Frum Community of Greater Montreal The following is a comprehensive study of the Frum Community residing in the Greater Montreal Metropolitan Area. It was designed to examine
2016 GREATER HOUSTON JEWISH COMMUNITY STUDY
 2016 GREATER HOUSTON JEWISH COMMUNITY STUDY Initial Report December 20161 Geographic Areas of Houston Zip Code Numbers without 77 and without leading zeros Example: The 24 on the map is 77024 382 North
The 2018 Jewish Federation of Metropolitan Detroit Population Study: Twelve Major Findings
 1 The 2018 Jewish Federation of Metropolitan Detroit Population Study: Twelve Major Findings Ira M. Sheskin, Ph.D. Director of the Jewish Demography Project of the Sue and Leonard Miller Center for Contemporary
BAY AREA JEWISH LIFE. Community Study Highlights A PORTRAIT OF AND COMMUNITIES. Published February 13, Commissioned and supported by:
 A PORTRAIT OF BAY AREA JEWISH LIFE AND COMMUNITIES Community Study Highlights Published February 13, 2018 Commissioned and supported by: The Jewish Community Federation of San Francisco, the Peninsula,
Jewish Community Study
 1 The 2008 Greater Middlesex Jewish Community Study Ira M. Sheskin, Ph.D. Director of the Jewish Demography Project of the Sue and Leonard Miller Center for Contemporary Judaic Studies and Associate Professor,
Survey of Church Members
 Survey of Church Members conducted for the Allegheny East Conference of the Seventh-day Adventist Church Bradford-Cleveland-Brooks Leadership Center Oakwood University August 2008 Introduction A random
April Parish Life Survey. Saint Elizabeth Ann Seton Parish Las Vegas, Nevada
 April 2017 Parish Life Survey Saint Elizabeth Ann Seton Parish Las Vegas, Nevada Center for Applied Research in the Apostolate Georgetown University Washington, DC Parish Life Survey Saint Elizabeth Ann
The American Religious Landscape and the 2004 Presidential Vote: Increased Polarization
 The American Religious Landscape and the 2004 Presidential Vote: Increased Polarization John C. Green, Corwin E. Smidt, James L. Guth, and Lyman A. Kellstedt The American religious landscape was strongly
The Reform and Conservative Movements in Israel: A Profile and Attitudes
 Tamar Hermann Chanan Cohen The Reform and Conservative Movements in Israel: A Profile and Attitudes What percentages of Jews in Israel define themselves as Reform or Conservative? What is their ethnic
BRITAIN S JEWISH COMMUNITY STATISTICS 2007
 REPORT OF THE COMMUNITY RESEARCH UNIT BOARD OF DEPUTIES OF BRITISH JEWS BRITAIN S JEWISH COMMUNITY STATISTICS 2007 By DAVID GRAHAM & DANIEL VULKAN Issued November 2008 Table of Contents Summary of Key
Greater Seattle Jewish Community Study
 OF GREATER SEATTLE 2014 Greater Seattle Jewish Community Study SECTION P: Synagogue Members Research conducted by: Matthew Boxer, Janet Krasner Aronson Matthew A. Brown, Leonard Saxe Cohen Center for Modern
The Changing Population Profile of American Jews : New Findings
 The Fifteenth World Congress of Jewish Studies Jerusalem, Israel August, 2009 The Changing Population Profile of American Jews 1990-2008: New Findings Barry A. Kosmin Research Professor, Public Policy
East Bay Jewish Community Study 2011
 East Bay Jewish Community Study 2011 Demographic Survey Executive Summary Facilitated by Greenberg Quinlan Rosner Research Executive Summary The Jewish Community of the East Bay is imbued with a rich array
THE ALUMNI OF YOUNG JUDAEA: A LONG-TERM PORTRAIT OF JEWISH ENGAGEMENT
 THE ALUMNI OF YOUNG JUDAEA: A LONG-TERM PORTRAIT OF JEWISH ENGAGEMENT SURVEY FIELDED: JUNE 18, 2017 OCTOBER 18, 2017 REPORT PUBLISHED: MARCH 1, 2018 Prof. Steven M. Cohen Hebrew Union College-Jewish Institute
American Views on Sin. Representative Survey of 1,000 Americans
 American Views on Sin Representative Survey of 1,000 Americans 2 Methodology LifeWay Research conducted the study Sept. 27 Oct. 1, 2016. The survey was conducted using the web-enabled KnowledgePanel, a
Russian American Jewish Experience
 Russian American Jewish Experience RAJE Background & Long Term Impact of the RAJE Fellowship Program Results of the Research Institute for New Americans (RINA) Long Term Impact Study FROM LET MY PEOPLE
THE INSTITUTE FOR JEWISH POLICY RESEARCH THE POLITICAL LEANINGS OF BRITAIN S JEWS APRIL 2010
 THE INSTITUTE FOR JEWISH POLICY RESEARCH THE POLITICAL LEANINGS OF BRITAIN S JEWS APRIL 20 About JPR JPR, the Institute for Jewish Policy Research, is a London-based independent research unit and think-tank
Major Themes of This Study
 Major Themes of This Study A Slowly Growing Community 17,500 persons live in 8,800 Jewish households in Sarasota-Manatee. Of the 17,500 persons, 89% (15,500 persons) are Jewish. The number of Jewish households
A Portrait of Jewish Columbus
 A Portrait of Jewish Columbus EXECUTIVE SUMMARY 2013 March 2014 Counting Jews has been going on since Biblical times. Having a proper census has helped us understand our strengths, needs and potential.
America s Changing Religious Landscape
 Religion & Public Life America s Changing Religious Landscape Christians Decline Sharply as Share of Population; Unaffiliated and Other Faiths Continue to Grow The Christian share of the U.S. population
Changes in Demand for Food Assistance at New York City Emergency Food Programs After September 11, 2001
 Changes in Demand for Assistance at New York City Emergency Programs After September 11, 21 Final Report Prepared By, For Survival Research and Policy Department September 22 Copyright 22 by the About
Congregational Survey Results 2016
 Congregational Survey Results 2016 1 EXECUTIVE SUMMARY Making Steady Progress Toward Our Mission Over the past four years, UUCA has undergone a significant period of transition with three different Senior
The World Wide Web and the U.S. Political News Market: Online Appendices
 The World Wide Web and the U.S. Political News Market: Online Appendices Online Appendix OA. Political Identity of Viewers Several times in the paper we treat as the left- most leaning TV station. Posner
NATIONAL HOUSEHOLD SURVEY
 NATIONAL HOUSEHOLD SURVEY THE JEWISH COMMUNITY OF MONTREAL PART 7 THE SEPHARDIC COMMUNITY BY CHARLES SHAHAR APRIL 2015 2011 National Household Survey Analysis Part 7 The Sephardic Community By Charles
New Presbyterian Congregations
 The U.S. Congregational Life Survey New Presbyterian Congregations Deborah Bruce Katie Duncan Joelle Kopacz Cynthia Woolever 2013 Published by Research Services A Ministry of the Presbyterian Mission Agency
A Survey of Christian Education and Formation Leaders Serving Episcopal Churches
 A Survey of Christian Education and Formation Leaders Serving Episcopal Churches Summarized by C. Kirk Hadaway, Director of Research, DFMS In the late fall of 2004 and spring of 2005 a survey developed
Part 3. Small-church Pastors vs. Large-church Pastors
 100 Part 3 -church Pastors vs. -church Pastors In all, 423 out of 431 (98.1%) pastors responded to the question about the size of their churches. The general data base was divided into two parts using
Treatment of Muslims in Broader Society
 Treatment of Muslims in Broader Society How Muslims are treated in Canada Muslims are a bit more positive than in 200 about how they are viewed by mainstream society, and most agree they are better off
NUMBERS, FACTS AND TRENDS SHAPING THE WORLD FOR RELEASE DECEMBER 30, 2013
 NUMBERS, FACTS AND TRENDS SHAPING THE WORLD FOR RELEASE DECEMBER 30, 2013 FOR FURTHER INFORMATION ON THIS REPORT: Alan Cooperman, Director of Religion Research Cary Funk, Senior Researcher Erin O Connell,
Westminster Presbyterian Church Discernment Process TEAM B
 Westminster Presbyterian Church Discernment Process TEAM B Mission Start Building and document a Congregational Profile and its Strengths which considers: Total Membership Sunday Worshippers Congregational
Center for Applied Research in the Apostolate
 Special Report: Parish Life Today About CARA CARA is a national, non-profit, Georgetown University affiliated research center that conducts social scientific studies about the Catholic Church. Founded
The 2007 Jewish Community Study of the Lehigh Valley. Main Report Volume I: Chapters 1-7
 The 2007 Jewish Community Study of the Lehigh Valley Main Report Volume I: Chapters 1-7 Ira M. Sheskin, Ph.D. Director of the Jewish Demography Project of the Sue and Leonard Miller Center for Contemporary
CHAPTER FOUR RESEARCH FINDINGS. Introduction. D.Min. project. A coding was devised in order to assign quantitative values to each of the
 CHAPTER FOUR RESEARCH FINDINGS Introduction The survey (Appendix C) sent to 950 women alumnae of Dallas Seminary resulted in 377 (41%) valid surveys which were used to compute the results of this D.Min.
American Views on Honor and Shame. Representative Survey of 1,000 Americans
 American Views on Honor and Shame Representative Survey of 1,000 Americans 2 Methodology LifeWay Research conducted the study Sept. 27 Oct. 1, 2016. The survey was conducted using the web-enabled KnowledgePanel,
CHAPTER 7 DIVERSE JEWISH 211 COMMUNITIES
 CHAPTER 7 DIVERSE JEWISH 211 COMMUNITIES As the foregoing chapters have demonstrated, New York Jewry is far from homogenous. Rather, its long history, waves of immigration, social-class differences, geographic
Religious and Demographic Profile of Presbyterians, 2011
 Religious and Demographic Profile of Presbyterians, 2011 Findings from the Initial Survey of the 2012-2014 Presbyterian Panel Table of Contents OVERVIEW... i HIGHLIGHTS... iii CHURCH ACTIVITIES AND INVOLVEMENT...
The 2018 Jewish Federation of Metropolitan Detroit Population Study: A Portrait of the Detroit Community
 1 The 2018 Jewish Federation of Metropolitan Detroit Population Study: A Portrait of the Detroit Community Jewish Education Congregational Schools Ira M. Sheskin, Ph.D. Director of the Jewish Demography
Churchgoers Views - Tithing. Representative Survey of 1,010 American Churchgoers
 Churchgoers Views - Tithing Representative Survey of 1,010 American Churchgoers 2 Methodology LifeWay Research conducted the study August 22 30, 2017. The survey was conducted using the web-enabled KnowledgePanel,
Union for Reform Judaism. URJ Youth Alumni Study: Final Report
 Union for Reform Judaism URJ Youth Alumni Study: Final Report February 2018 Background and Research Questions For more than half a century, two frameworks have served the Union for Reform Judaism as incubators
Mind the Gap: measuring religiosity in Ireland
 Mind the Gap: measuring religiosity in Ireland At Census 2002, just over 88% of people in the Republic of Ireland declared themselves to be Catholic when asked their religion. This was a slight decrease
University System of Georgia Survey on Student Speech and Discussion
 University System of Georgia Survey on Student Speech and Discussion May 2008 Conducted for the Board of Regents University System of Georgia by By James J. Bason, Ph.D. Director and Associate Research
American Parishes in the Twenty-First Century
 The Australasian Catholic Record, Volume 92 Issue 2 (April 2015) 197 American Parishes in the Twenty-First Century Mary L. Gautier* It is exciting to be witness to the twenty-first century in American
Young Adult Catholics This report was designed by the Center for Applied Research in the Apostolate (CARA) at Georgetown University for the
 at Georgetown University for the") Center Special for Applied Research in the Apostolate. Report Georgetown University. Washington, D.C. Serving Dioceses, Parishes, and Religious Communities Since 196 Fall 2002 Young Adult Catholics This
Center Special for Applied Research in the Apostolate. Report Georgetown University. Washington, D.C. Serving Dioceses, Parishes, and Religious Communities Since 196 Fall 2002 Young Adult Catholics This
Jury Service: Is Fulfilling Your Civic Duty a Trial?
 Jury Service: Is Fulfilling Your Civic Duty a Trial? Prepared for: The American Bar Association July 2004 Table of Contents Page Background and Methodology 3 Executive Summary 4 Detailed Findings 7 Respondent
How Are Worshipers Involved in the Community?
 How Are Worshipers Involved in the Community? Findings from the U.S. Congregational Life Survey Congregations and worshipers focus on their communities in a wide variety of ways, from helping the poor
Pastor Views on Tithing. Survey of Protestant Pastors
 Pastor Views on Tithing Survey of Protestant Pastors 2 Methodology The phone survey of 1,000 Protestant pastors was conducted August 30 September 18, 2017 The calling list was a stratified random sample,
Churchgoers Views Strength of Ties to Church. Representative Survey of 1,010 American Churchgoers
 Churchgoers Views Strength of Ties to Church Representative Survey of 1,010 American Churchgoers 2 Methodology LifeWay Research conducted the study August 22 30, 2017. The survey was conducted using the
Mandell L. Berman Institute North American Jewish Data Bank, Center for Judaic Studies and Contemporary Jewish Life
 THIS PUBLICATION IS PROVIDED BY THE NORTH AMERICAN JEWISH DATA BANK WITH PERMISSION FROM THE STUDY AUTHORS. THE NORTH AMERICAN JEWISH DATA BANK IS A COLLABORATIVE PROJECT OF THE JEWISH FEDERATIONS OF NORTH
Christians Say They Do Best At Relationships, Worst In Bible Knowledge
 June 14, 2005 Christians Say They Do Best At Relationships, Worst In Bible Knowledge (Ventura, CA) - Nine out of ten adults contend that their faith is very important in their life, and three out of every
THE SEVENTH-DAY ADVENTIST CHURCH AN ANALYSIS OF STRENGTHS, WEAKNESSES, OPPORTUNITIES, AND THREATS (SWOT) Roger L. Dudley
 Roger L. Dudley") THE SEVENTH-DAY ADVENTIST CHURCH AN ANALYSIS OF STRENGTHS, WEAKNESSES, OPPORTUNITIES, AND THREATS (SWOT) Roger L. Dudley The Strategic Planning Committee of the General Conference of Seventh-day Adventists
THE SEVENTH-DAY ADVENTIST CHURCH AN ANALYSIS OF STRENGTHS, WEAKNESSES, OPPORTUNITIES, AND THREATS (SWOT) Roger L. Dudley The Strategic Planning Committee of the General Conference of Seventh-day Adventists
El Monte Community Assessment. A report by Elder Monte Sahlin Center for Creative Ministry August 2011
 El Monte Community Assessment A report by Elder Monte Sahlin Center for Creative Ministry August 2011 1 Who is Monte Sahlin? An ordained Seventh-day Adventist minister for 40 years who has done assessments
Views on Ethnicity and the Church. From Surveys of Protestant Pastors and Adult Americans
 Views on Ethnicity and the Church From Surveys of Protestant Pastors and Adult Americans Protestant Pastors Views on Ethnicity and the Church Survey of 1,007 Protestant Pastors 3 Methodology The telephone
THERE is an obvious need for accurate data on the trend in the number of. in the Republic of Ireland, BRENDAN M. WALSH*
 Trends in the Religious in the Republic of Ireland, Composition of the Population BRENDAN M. WALSH* Abstract: Compared with 1946 there were more Catholics in the Republic in 1971 but 24 per cent fewer
NCLS Occasional Paper Church Attendance Estimates
 NCLS Occasional Paper 3 2001 Church Attendance Estimates John Bellamy and Keith Castle February 2004 2001 Church Attendance Estimates John Bellamy and Keith Castle February 2004 Introduction The National
American Views on Assisted Suicide. Representative Survey of 1,000 Americans
 American Views on Assisted Suicide Representative Survey of 1,000 Americans 2 Methodology LifeWay Research conducted the study Sept. 27 Oct. 1, 2016. The survey was conducted using the web-enabled KnowledgePanel,
A Comparison of Pentecostal and Mainline Churchgoers in Nigeria s South South NPCRC Technical Report #N1106
 A Comparison of and Churchgoers in Nigeria s South South NPCRC Technical Report #N1106 Dr. K. A. Korb 28 November 2012 1 Executive Summary The Nigerian and Charismatic Research Centre collected information
Portrait of a Regional Conference Revisited
 Portrait of a Regional Conference Revisited The Allegheny East Conference of the Seventh-day Adventist Church By Monte Sahlin & Paul Richardson Monte Sahlin has conducted several major research projects
Note: Results are reported by total population sampled; and sub-samples. See final page for details.
 The 11th Biannual Youth Survey on Politics and Public Service Field Dates: October 4 October 16, 2006 Master Questionnaire; N=2,546 18-24 Year Olds Margin of Error: ± 1.9% Note: Results are reported by
Men practising Christian worship
 Men practising Christian worship The results of a YouGov Survey of GB adults All figures are from YouGov Plc. Total sample size was 7,212 GB 16+ adults. Fieldwork was undertaken between 23rd - 26th September
Transformation 2.0: Baseline Survey Summary Report
 Transformation 2.0: Baseline Survey Summary Report Authorized by: The Presbytery of Cincinnati Congregational Development Task Force Conducted and Produced by The Missional Network 2 TABLE OF CONTENTS
U.S. Catholics Express Favorable View of Pope Francis
 0 April 3, 2013 First Reactions More Positive than for Pope Benedict U.S. Catholics Express Favorable View of Pope Francis FOR FURTHER INFORMATION CONTACT: Alan Cooperman Associate Director, Pew Research
The Fifth National Survey of Religion and Politics: A Baseline for the 2008 Presidential Election. John C. Green
 The Fifth National Survey of Religion and Politics: A Baseline for the 2008 Presidential Election John C. Green Ray C. Bliss Institute of Applied Politics University of Akron (Email: green@uakron.edu;
The Portrait. Commissioned and supported by: Jewish Community Federation and Endowment Fund. In cooperation with:
 ACKNOWLEDGMENTS The Portrait Commissioned and supported by: Jewish Community Federation and Endowment Fund Richard Fiedotin, Board Chair Danny Grossman, CEO Julie Golde, Senior Director of Community Impact
Evangelicals, the Gospel, and Jewish People
 Evangelicals, the Gospel, and Jewish People Representative Survey of 2,002 Americans With Evangelical Beliefs Sponsored by Chosen People Ministries and Author, Joel C Rosenberg 2 Methodology LifeWay Research
Religious Life in England and Wales
 Religious Life in England and Wales Executive Report 1 study commissioned by the Compass Project Compass is sponsored by a group of Roman Catholic Religious Orders and Congregations. Introduction In recent
Churchgoers Views - Prosperity. Representative Survey of 1,010 American Churchgoers
 Churchgoers Views - Prosperity Representative Survey of 1,010 American Churchgoers 2 Methodology LifeWay Research conducted the study August 22 30, 2017. The survey was conducted using the web-enabled
A STATISTICAL PROFILE
 FA L L 2 01 8 A STATISTICAL PROFILE WITH REFLECTION/DISCUSSION QUESTIONS FOR CHURCH LEADERS RESEARCH FROM THE UCC CENTER FOR ANALYTICS, RESEARCH AND DATA (CARD) QUICK SUMMARY OF UCC STATISTICS MEMBERSHIP
Volunteerism. among American Jews. Laurence Kotler-Berkowitz Miriam Rieger United Jewish Communities
 United Jewish Communities Report Series on the National Jewish Population Survey 2000-01 Volunteerism among American Jews 9 Laurence Kotler-Berkowitz Miriam Rieger FEBRUARY 2005 report United Jewish Communities
Churchgoers Views Sabbath Rest. Representative Survey of 1,010 American Churchgoers
 Churchgoers Views Sabbath Rest Representative Survey of 1,010 American Churchgoers 2 Methodology LifeWay Research conducted the study August 22 30, 2017. The survey was conducted using the web-enabled
The numbers of single adults practising Christian worship
 The numbers of single adults practising Christian worship The results of a YouGov Survey of GB adults All figures are from YouGov Plc. Total sample size was 7,212 GB 16+ adults. Fieldwork was undertaken
Pastors Views on the Economy s Impact Survey of Protestant Pastors
 Pastors Views on the Economy s Impact 2018 Survey of Protestant Pastors 2 Methodology The phone survey of 1,000 Protestant pastors was conducted August 29 September 11, 2018 The calling list was a stratified
The 2017 Indianapolis Jewish Population Study: A Portrait of the Indianapolis Jewish Community
 The 2017 Indianapolis Jewish Population Study: A Portrait of the Indianapolis Jewish Community Main Report Volume II, Chapters 8-15 Ira M. Sheskin Professor and Chair Department of Geography University
Welfare and Standard of Living
 Welfare and Standard of Living Extent of poverty Marital status Households Monthly expenditure on consumption Ownership of durable goods Housing density Welfare and Standard of Living Extent of Poverty
Intermarriage Statistics David Rudolph, Ph.D.
 Intermarriage Statistics David Rudolph, Ph.D. I am fascinated by intermarrieds, not only because I am intermarried but also because intermarrieds are changing the Jewish world. Tracking this reshaping
American Views on Christmas. Representative Survey of American
 American Views on Christmas Representative Survey of American 2 Methodology LifeWay Research conducted the study September 21-23, 2018. The survey was conducted using the web-enabled KnowledgePanel, a
A Statistical Overview of the Southwestern Texas Synod With Comparisons to Synods in Region Four
 A Statistical Overview of the Synod With Comparisons to Synods in Region Four Research and Evaluation, Office of the Presiding Bishop Evangelical Lutheran Church in America March 2017 Territory The Synod
The Impact of Camp Ramah on the Attitudes and Practices of Conservative Jewish College Students
 122 Impact: Ramah in the Lives of Campers, Staff, and Alumni Mitchell Cohen The Impact of Camp Ramah on the Attitudes and Practices of Conservative Jewish College Students Adapted from the foreword to
Catholics Divided Over Global Warming
 NUMBERS, FACTS AND TRENDS SHAPING YOUR WORLD ABOUT FOLLOW US Search Religion & Public Life MENU RESEARCH AREAS JUNE 16, 2015 Catholics Divided Over Global Warming Partisan Differences Mirror Those Among
NATIONAL HOUSEHOLD SURVEY
 NATIONAL HOUSEHOLD SURVEY THE JEWISH COMMUNITY OF TORONTO PART 3 JEWISH SENIORS PART 4 THE JEWISH POOR BY CHARLES SHAHAR, SANDI PELLY & ROBIN GOFINE SEPTEMBER 2014 2011 National Household Survey Analysis
NJPS Methodology Series UJC Research Department
 Report #1 Religion in America: Comparing Data from NSRE/NJPS, GSS and ARIS The National Survey on Religion and Ethnicity (NSRE) was conducted in conjunction with NJPS 2000-01. This survey was administered