South-Central Westchester Sound Shore Communities River Towns North-Central and Northwestern Westchester
|
|
|
- Franklin Barrett
- 6 years ago
- Views:
Transcription
1 CHAPTER 9 WESTCHESTER South-Central Westchester Sound Shore Communities River Towns North-Central and Northwestern Westchester
2 WESTCHESTER 342
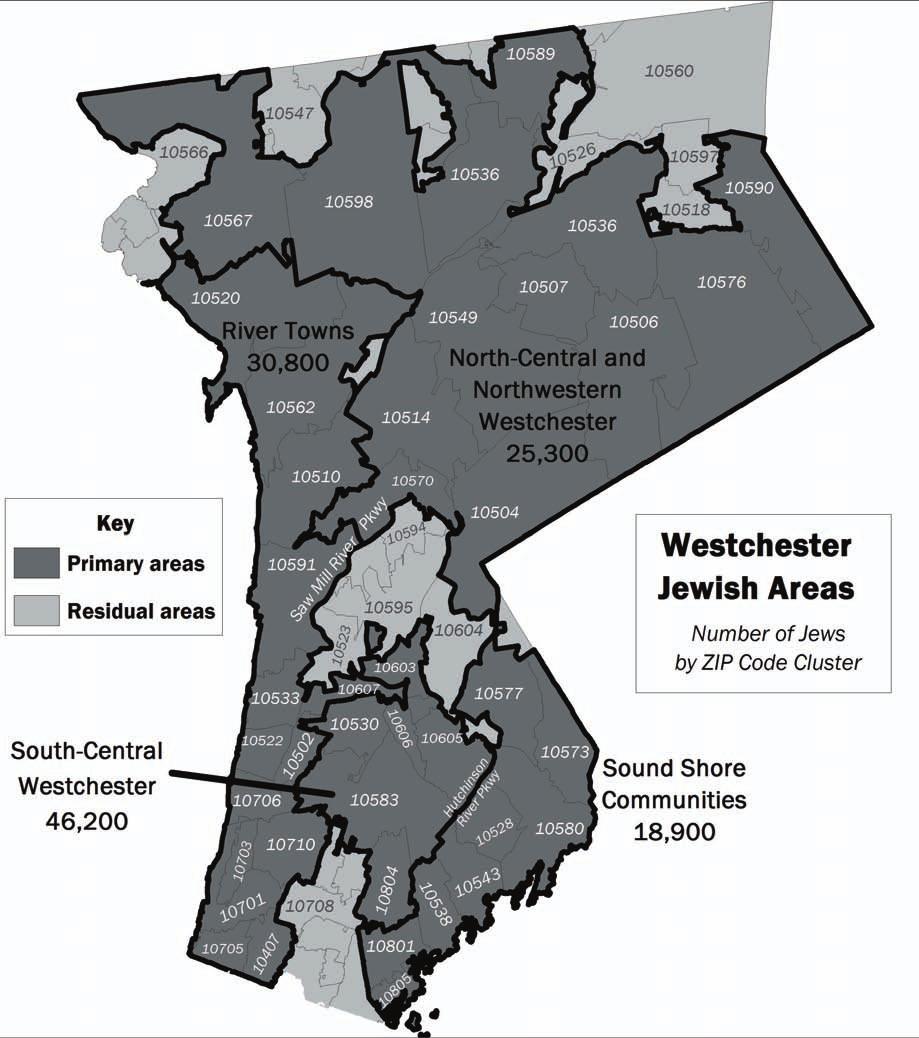
3 WESTCHESTER 343 Exhibit 42: Westchester: Population and Household Estimates by Area, 2011 Primary Area** South-Central Westchester Sound Shore Communities All Households (Census)* Jewish Households Jewish Households as a Percent of All Households Jews Jews in Area as a Percent of Jews in County All People (Census)* People in Jewish Households People in Jewish Households as a Percent of All People in Area 49,800 17,900 36% 46,200 34% 128,800 50,700 40% 59,400 9,200 15% 18,900 14% 170,400 22,900 14% River Towns 108,600 13,700 13% 30,800 23% 294,300 37,100 13% North-Central and Northwestern Westchester 49,100 10,000 20% 25,300 19% 141,100 32,400 23% Westchester Residual Areas** 80,217 9,200 10% 15,000 11% 214,522 18,100 8% TOTAL, WESTCHESTER COUNTY 347,200 60,000 17% 136, % 949, ,200 17% Sources: Jewish Community Study of New York: 2011 and 2010 U.S. Census data. Note: All data is rounded to the nearest hundred for presentation. * The 2010 U.S. Census based county household and population totals in this table differ slightly from the county totals listed in exhibit 1-13 in the Jewish Community Study of New York: 2011 Comprehensive Report either due to small rounding differences or because Jewish areas in this chart are based on clusters of ZIP codes and some ZIP codes cross county boundaries. Please note that when such boundary-crossing ZIP codes occur, the population s numbers are included in only one county. ** Primary areas are clusters of ZIP codes with at least 90 interviews corresponding to a population of at least 25,000 Jewish residents (and a margin of error below 14); this chapter includes complete profiles of the Jewish population in these areas. Residual areas consist of the population residing outside the areas described above.
4 WESTCHESTER 344 WESTCHESTER: COUNTY OVERVIEW Demography and Jewish Characteristics Over the past nine years, Westchester has experienced the largest Jewish population growth of the three suburban areas. In Westchester, from 2002 to 2011 there has been a 5% increase in both the number of Jews and in the number of people in Jewish households and a 9% increase in the number of Jewish households. This is dramatically different from the prior 11-year period, in which the number of Jewish households grew by 40% and people in Jewish households grew by 47%. The county s Jewish population is mostly concentrated in South-Central Westchester in such communities as Scarsdale, New Rochelle, and White Plains; substantial yet somewhat smaller Jewish concentrations are found in the River Towns and also in North-Central and Northwestern Westchester, in such places as Chappaqua and Briarcliff Manor. Westchester is exhibiting the same graying patterns as many of the other profiled counties (with the exception of Brooklyn and the Bronx). Since 2002, the percentage of children ages 17 and under in Westchester Jewish households has decreased from 27% to 21%, and the percentage of seniors has increased from 17% to 21%. During the past nine years in Westchester, the proportion of married or partnered individuals has decreased from 75% in 2002 to 67% in 2011 and the proportion of those who have never married has increased from 9% in 2002 to 16% in The most vivid manifestation of these changes is apparent in Westchester s changed household structure: from 2002 to 2011, the proportion of households with children ages 17 and under decreased from 39% to 28%. People in Need By all measures, Westchester is an affluent county. Fifty-four percent of Jewish households in this county have annual incomes of more than $100,000 and 44% report that they have extra money or are wealthy. In Westchester, only 22% of Jewish households have annual incomes of less than $50,000, which is substantially lower than the overall proportion of households in this income category (42%). Similarly, only 7% of Westchester Jewish households are poor, which is substantially lower than the proportion in the eight-county area (18%). Yet even in this economically robust area, 26% report that they cannot make ends meet or are just managing, a 30% increase since In Westchester, the men s employment rate (86%) is above the eight-county average (80%) and the women s employment rate (73%) is comparable to the average (71%). Only 44% of individuals ages 75 and over live alone, which is below the 53% eight-county rate.
5 WESTCHESTER 345 Jewish Engagement, Connections, and Education Since 2002, the proportion of Jews in Westchester who identify as Orthodox has remained about the same: 9% in 2002 and 11% in Concurrently, there has been a substantial decrease in the percentage of people who identify as Conservative, from 31% in 2002 to 22% in 2011, and a smaller decrease in Reform identification, from 42% in 2002 to 37% in From 2002 to 2011, there has been a more than threefold increase in the proportion of people who identify as secular or no religion, from 6% in 2002 to 20% in There have been some small increases in several Jewish ritual behaviors since 2002, specifically in the proportion that light Shabbat candles and keep kosher. Although Westchester s Jewish-engagement profile is somewhat lower than the county s 2002 profile, it is comparable to the overall eight-county 2011 rates; for example, the proportion in Westchester that states being Jewish is very important to them decreased from 59% in 2002 to 55% in 2011 yet remains consistent with the overall rate (57%). Similarly, travel to Israel has decreased slightly from 54% in 2002 to 51% in 2011 (which is similar to the overall rate of 49%) and 54% have attended a Jewish cultural event, higher than the overall rate (49%) yet lower than Westchester s 2002 rate (66%). Inconsistent with this pattern is the decreased percentage from 31% in 2002 to 22% in 2011 of Jewish children ages 5 to 17 who attend or have attended Jewish day school and the county s slightly increased intermarriage rate, from 25% in 2002 to 28% in 2011, which is above the overall intermarriage rate (22%). Philanthropy Westchester s philanthropic giving is consistent with its economic profile. Ninety percent of its Jewish households make charitable gifts (compared with 82% overall) and 62% donate to a combination of Jewish and non-jewish causes (compared with 44% overall); 4% donate exclusively to Jewish charities, a lower percentage than overall (15%). Although the proportion of Westchester Jewish households that donates to UJA-Federation of New York is the second highest in the eight-county area, Westchester has also experienced a 24% decrease in the number of households reporting a donation to UJA-Federation of New York, from 45% in 2002 to 35% in 2011 the single largest decline in reported UJA-Federation of New York giving across the eight counties.
6 WESTCHESTER 346 Exhibit 43: Westchester: Jewish Population Estimates, 1991, 2002, and 2011 Population Estimates Jewish Households 39,000 54,600 60,000 Jews 92, , ,200 People in Jewish Households (including non-jews) 104, , ,200 People in Jewish Households as a All People in County 12% 17% 17% Exhibit 43a: Westchester: Demography and Social Characteristics, 2011 Age Distribution All People in Jewish Households % % % % % Marital Status All Respondents Married 63% Partnered 4% Never Married 16% Separated or Divorced 7% Widowed 11% Households Russian-Speaking Jewish Households 4% Households With a Holocaust Survivor 5%
7 WESTCHESTER 347 Exhibit 43a (continued): Westchester: Demography and Social Characteristics, 2011 Household Composition ( Households) Households With Children 17 and Younger Households With Only Adults Households With Seniors 65+ (no children 17 and younger) 28% 36% 35% Annual Household Income Households Under $50,000 22% $50,000 $99,999 25% $100,000 $149,000 24% $150, % Home Ownership Households Own 83% Rent 17% Employment Status by Gender Respondents and Spouses Ages Employed Males* 86% Employed Females* 73% * Includes full-time, part-time, and self-employed.
8 WESTCHESTER 348 Exhibit 43b: Westchester: People In Need, 2011 Subjective Assessment of Household Financial Condition Households Cannot Make Ends Meet or Just Managing 26% Have Enough 30% Have Extra Money or Wealthy 44% Poverty ( Households) Poor: Under 150% of Federal Poverty Guideline Near Poor: Between 150% 250% of Federal Poverty Guideline Above Poverty or Poverty Status Unknown 7% 5% 88% Vulnerable Seniors Senior Households Need Help With Activities of Daily Living 16% Isolated Seniors Seniors in Age Group Ages 65 to 74 Living Alone 10% Ages 75+ Living Alone 44% Seeking Assistance for Human-Service Needs Number of Households* Assistance for Household Member s Serious or Chronic Illness 7,700 Help With Food or Housing 2,700 Help Finding a Job or Choosing an Occupation 8,500 Services for an Adult With a Disability 11,200 Homecare Services for an Older Adult in the Household 1,500 Help for a Child With a Physical, Developmental, or Learning Disability or Other Special Needs 4,500 * We are reporting absolute numbers rather than percentages for this variable because, due to filtering, the information is based on a small amount of data and we believe that local areas are most interested in actual numbers.
9 WESTCHESTER 349 Exhibit 43c: Westchester: Jewish Engagement, Connections, and Education, 2011 Denomination ( Respondents) Orthodox Conservative Reform Nondenominational Just Jewish Secular, No Religion, and Other 11% 22% 11% 20% 37% Jewish Affiliations and Participation Percent Synagogue Member, Anyone in Household 52% JCC: Anyone in Household Went to a Program in Past Year 38% Jewish Organization, Belong/Regularly Participate, Anyone in Household 24% Jewish Museum or Jewish Cultural Event, Respondent Went in Past Year 54% Respondent Has Ever Traveled to Israel 51% Respondent Feels Very Attached to Israel 39% Respondent s Closest Friends Are Mostly Jewish 48% Feeling Connected Respondents Being Jewish Is Very Important 55% Being Part of Jewish Community Is Very Important 41% Feels Part of a Jewish Community A Lot 37% Wish Knew More About Being Jewish 21% Jewish-Engagement Level 55 Percent High 39% Moderate 27% Low 34% 55 These percentages are based on the Index of Jewish Engagement as defined on page 118 of the Jewish Community Study of New York: 2011 Comprehensive Report. This summary classification consists of 12 items: attending a program or event at a Jewish community center or YM-YWHA; belonging to a synagogue; belonging to a Jewish organization; usually or always attending a Passover seder; usually or always lighting Sabbath candles; usually or always lighting Chanukah candles; feeling it s very important to be part of a Jewish community; regularly talking about Jewish-related topics with Jewish friends; feeling a lot a part of a Jewish community; volunteering for Jewish organizations or causes; having closest friends who are mostly Jewish; and contributing to any Jewish charity, including UJA-Federation of New York. Households with high scores affirmed seven or more items, with moderate scores affirmed four to six items, and with low scores affirmed three or fewer items.
10 WESTCHESTER 350 Exhibit 43c (continued): Westchester: Jewish Engagement, Connections, and Education, 2011 Jewish Practices and Behaviors Percent Household Member Attends Seder Usually + Always 75% Chanukah Candles Lit in Household Usually + Always 71% Yom Kippur, Respondent Fasts All Day 57% Sabbath Candles Lit Friday Night in Household Usually + Always 24% Kosher Household 20% Shabbat Meal, Respondent Participates Sometimes + Regularly 45% Respondent Talks Regularly About Jewish-Related Topics With Jewish Friends 35% Respondent Studies Informally, Alone, With Friend, or With Teacher 35% Jewish Education Jewish Children Ages 5 17 Day School Current or Previous 22% Supplemental School Current or Previous 53% Tutoring or Other Type of Jewish Education Current or Previous 11% None Ever 15% Number of Jewish Children Ages 0 4* Jewish Preschool or Daycare Program 1,300 In-Married and Intermarried Households Married Couples In-Married (including conversionary marriages) 72% Intermarried 28% * We are reporting absolute numbers rather than percentages for this variable because, due to filtering, the information is based on a small amount of data and we believe that local areas are most interested in actual numbers.
11 WESTCHESTER 351 Exhibit 43d: Westchester: Philanthropy and Volunteering, 2011 Charitable Giving ( Households) Both Jewish and Non-Jewish Gifts Jewish Gifts Only Non-Jewish Gifts Only No Charitable Gift 4% 24% 10% 62% Giving to UJA-Federation of New York Households Contributed to UJA-Federation 35% All Respondents Volunteering Who Volunteer* Both Jewish and Non-Jewish Organizations 49% Jewish Organizations Only 11% Non-Jewish Organizations Only 41% * Asked only of respondents who said they volunteered their time for any type of charitable organization.

12 WESTCHESTER SOUTH-CENTRAL WESTCHESTER 352 SOUTH-CENTRAL WESTCHESTER Demography and Social Characteristics South-Central Westchester includes the areas of Scarsdale, New Rochelle, White Plains, and Hartsdale. In South-Central Westchester, there are 17,900 Jewish households in which 50,700 people reside, of whom 46,200 are Jews. The area s Jewish density is 40%, which is quite high. South-Central Westchester s Jewish population has increased 26% since In the area, 20% of the people in Jewish households are ages 65 and over and 26% are under age 18, the highest proportion of children of any of the profiled Westchester areas. South-Central Westchester household structures are fairly balanced between those that contain a child (35%) and those that are senior households (38%), containing only seniors and no one under age 18. In South-Central Westchester, 73% of respondents are married or partnered and only 9% have never been married, lower than both the Westchester rate and the eight-county rate of those who have never married (16% and 21%, respectively). Five percent of Jewish households in this area include a Russian speaker and 7% include a Holocaust survivor. 56 Comparisons in this narrative are based on recalculations of the 2002 data to reflect the 2011 ZIP code groupings.
13 WESTCHESTER SOUTH-CENTRAL WESTCHESTER 353 People in Need South-Central Westchester appears to be an economically stable area as evidenced by the nearly 1 in 5 (19%) households with annual incomes of under $50,000, comparable to the Westchester rate (22%) and a little less than half of the eight-county rate (42%). Sixty-three percent of area households have annual incomes of $100,000 or more, which is both higher than the Westchester rate (54%) and more than twice as high as the eight-county rate (30%). The employment rate for men in South-Central Westchester (91%) is above the eight-county average (80%), and for women the employment rate (72%) is comparable to the eight-county rate (71%). In South-Central Westchester, only 39% of those ages 75 and over live alone, which is lower than the overall rate (53%). Jewish Engagement, Connections, and Education On multiple indicators, South-Central Westchester qualifies as one of the most Jewishly connected and identified areas. Nearly a fifth (19%) of the area s respondents identify as Orthodox (the highest percentage of all the profiled Westchester areas), 22% as Conservative, 35% as Reform, and 15% as secular or having no religion. In this area, 70% of households belong to a synagogue, one of the highest proportions in the eight-county area. Jewish residents in this area also exhibit high rates of participation in Jewish community center programs (52%), Jewish cultural attendance (65%), and having traveled to Israel (71% in this area, compared with 51% in Westchester and 49% overall in the eight-county area). Corresponding with their strong formal Jewish connections, Jewish residents of South-Central Westchester have strong subjective feelings of Jewish identity: 70% state that being Jewish is very important to them and 56% say that being part of a Jewish community is very important to them, considerably higher than the Westchester (41%) and the eight-county rates (44%). Fifty-eight percent of Jewish respondents in this area report that most of their close friends are Jewish higher than in Westchester (48%) and the eight-county area (52%). This might at least partially account for the finding that only 16% of marriages in this area are intermarriages, lower than overall in Westchester. Philanthropy South-Central Westchester s level of philanthropy to Jewish causes exceeds the Westchester rate and also the eight-county rate: 73% of households donate to a combination of Jewish and non-jewish causes and 6% donate exclusively to Jewish causes; only 15% donate exclusively to non-jewish causes, lower than overall in Westchester and in the eight-county area (24% for both). Forty-three percent of the households in this area say they contribute to UJA-Federation of New York; in fact, in terms of its rate of contributing to UJA-Federation, South-Central Westchester is the third-highest area in the eight counties, after Great Neck and the Five Towns.
14 WESTCHESTER SOUTH-CENTRAL WESTCHESTER 354 Exhibit 44: South-Central Westchester: Jewish Population Estimates, 2002 and 2011 Population Estimates Jewish Households 14,200 17,900 Jews 36,600 46,200 People in Jewish Households (including non-jews) 39,300 50,700 People in Jewish Households as a All People in Area 32% 40% Exhibit 44a: South-Central Westchester: Demography and Social Characteristics, 2011 Age Distribution All People in Jewish Households % % % % % Marital Status All Respondents Married 70% Partnered 3% Never Married 9% Separated or Divorced 5% Widowed 14% Households Russian-Speaking Jewish Households 5%
15 WESTCHESTER SOUTH-CENTRAL WESTCHESTER 355 Exhibit 44a (continued): South-Central Westchester: Demography and Social Characteristics, 2011 Household Composition ( Households) Households With Children 17 and Younger Households With Only Adults Households With Seniors 65+ (no children 17 and younger) 35% 27% 38% Annual Household Income Households Under $50,000 19% $50,000 $99,999 19% $100,000 $149,000 30% $150, % Home Ownership Households Own 88% Rent 12% Employment Status by Gender Respondents and Spouses Ages Employed Males* 91% Employed Females* 72% * Includes full-time, part-time, and self-employed.
16 WESTCHESTER SOUTH-CENTRAL WESTCHESTER 356 Exhibit 44b: South-Central Westchester: People In Need, 2011 Subjective Assessment of Household Financial Condition Households Cannot Make Ends Meet or Just Managing 29% Have Enough 19% Have Extra Money or Wealthy 52% Poverty ( Households) Poor: Under 150% of Federal Poverty Guideline Near Poor: Between 150% 250% of Federal Poverty Guideline Above Poverty or Poverty Status Unknown 8% 5% 87% Vulnerable Seniors Senior Households Need Help With Activities of Daily Living 20% Isolated Seniors Seniors in Age Group Ages 65 to 74 Living Alone 9% Ages 75+ Living Alone 39% Seeking Assistance for Human-Service Needs Number of Households* Assistance for Household Member s Serious or Chronic Illness 1,900 Help With Food or Housing 1,000 Help Finding a Job or Choosing an Occupation 1,800 Services for an Adult With a Disability 2,900 Homecare Services for an Older Adult in the Household 600 Help for a Child With a Physical, Developmental, or Learning Disability or Other Special Needs 2,300 * We are reporting absolute numbers rather than percentages for this variable because, due to filtering, the information is based on a small amount of data and we believe that local areas are most interested in actual numbers.
17 WESTCHESTER SOUTH-CENTRAL WESTCHESTER 357 Exhibit 44c: South-Central Westchester: Jewish Engagement, Connections, and Education, 2011 Denomination ( Respondents) Orthodox Conservative Reform Nondenominational Just Jewish Secular, No Religion, and Other 19% 22% 10% 15% 35% Jewish Affiliations and Participation Percent Synagogue Member, Anyone in Household 70% JCC: Anyone in Household Went to a Program in Past Year 52% Jewish Organization, Belong/Regularly Participate, Anyone in Household 33% Jewish Museum or Jewish Cultural Event, Respondent Went in Past Year 65% Respondent Has Ever Traveled to Israel 71% Respondent Feels Very Attached to Israel 50% Respondent s Closest Friends Are Mostly Jewish 58% Feeling Connected Respondents Being Jewish Is Very Important 70% Being Part of Jewish Community Is Very Important 56% Feels Part of a Jewish Community A Lot 51% Wish Knew More About Being Jewish 22% Jewish-Engagement Level* Percent High 58% Moderate 25% Low 17% * See page 349 for a description of the Index of Jewish Engagement and definitions of high, moderate, and low scores.
18 WESTCHESTER SOUTH-CENTRAL WESTCHESTER 358 Exhibit 44c (continued): South-Central Westchester: Jewish Engagement, Connections, and Education, 2011 Jewish Practices and Behaviors Percent Household Member Attends Seder Usually + Always 87% Chanukah Candles Lit in Household Usually + Always 79% Yom Kippur, Respondent Fasts All Day 69% Sabbath Candles Lit Friday Night in Household Usually + Always 36% Kosher Household 30% Shabbat Meal, Respondent Participates Sometimes + Regularly 61% Respondent Talks Regularly About Jewish-Related Topics With Jewish Friends 38% Respondent Studies Informally, Alone, With Friend, or With Teacher 37% Jewish Education Jewish Children Ages 5 17 Day School Current or Previous 33% Supplemental School Current or Previous 35% Tutoring or Other Type of Jewish Education Current or Previous 12% None Ever 21% Number of Jewish Children Ages 0 4** Jewish Preschool or Daycare Program 800 ** We are reporting absolute numbers rather than percentages for this variable because, due to filtering, the information is based on a small amount of data and we believe that local areas are most interested in actual numbers. In-Married and Intermarried Households Married Couples In-Married (including conversionary marriages) 84% Intermarried 16%
19 WESTCHESTER SOUTH-CENTRAL WESTCHESTER 359 Exhibit 44d: South-Central Westchester: Philanthropy and Volunteering, 2011 Charitable Giving ( Households) Both Jewish and Non-Jewish Gifts Jewish Gifts Only Non-Jewish Gifts Only No Charitable Gift 6% 15% 5% 73% Giving to UJA-Federation of New York Households Contributed to UJA-Federation 43% Volunteering All Respondents Who Volunteer* Both Jewish and Non-Jewish Organizations 50% Jewish Organizations Only 20% Non-Jewish Organizations Only 30% * Asked only of respondents who said they volunteered their time for any type of charitable organization. See exhibit B-26 on page 424 for the total percent that volunteered within this area.

20 WESTCHESTER SOUND SHORE COMMUNITIES 360 SOUND SHORE COMMUNITIES Demography and Social Characteristics The Sound Shore Communities include Larchmont, New Rochelle, Mamaroneck, Rye, and Harrison/ Purchase. In this area are 9,200 Jewish households in which 22,900 people reside, of whom 18,900 are Jews. The Sound Shore Communities Jewish density is 14%, which means that people in Jewish households in the area make up 14% of the entire area s population. Since 2002, the area s Jewish population has remained stable with no growth or population decrease. 57 Children under age 18 compose 23% of the people in Jewish households in the area, and seniors ages 65 and over compose another 21%. The largest age group in this area (37%) consists of people ages 40 to 64. The Sound Shore Communities household structure is almost evenly balanced among households that include children (33%), households containing people ages 40 to 64 but no children and no seniors (31%), and senior households containing only seniors and no one under age 18 (36%). In this area, 57% are married or partnered and 19% have never been married. People in Need The Sound Shore Communities Jewish households generally appear to be financially well-off, but there are several indications that they might not be as affluent as other Jewish areas in Westchester. Although only 20% of households have annual incomes of under $50,000 (below both the Westchester and eight-county averages), 9% are poor, which is above the Westchester rate though below the eight-county 57 Comparisons in this narrative are based on recalculations of the 2002 data to reflect the 2011 ZIP code groupings.
21 WESTCHESTER SOUND SHORE COMMUNITIES 361 average (19%). Additionally, this area has a lower proportion of households with annual incomes of $100,000 or more (47%) than overall in Westchester (54%), although this proportion is considerably above the regional rate (30%). The proportion that owns their own homes in the Sound Shore Communities (74%) is also lower than overall in Westchester (83%). In this area, 88% of the men are employed (above the eight-county rate of 80%) and 65% of the women are employed (below the eight-county rate of 71%). In the South Shore Communities, 49% of those ages 75 and older live alone, which is the highest rate in Westchester yet slightly lower than the eight-county rate (53%). Jewish Engagement, Connections, and Education Forty-one percent of the Sound Shore Communities respondents identify as Reform, 22% identify as Conservative, 2% identify as Orthodox, and 26% identify as secular or having no religion the highest proportion in Westchester. In terms of formal Jewish connections, the area is on par or somewhat below the overall Westchester rates on a variety of Jewish indicators: 44% of Jewish households belong to a synagogue, compared with 52% in Westchester; 34% participate in programs at Jewish community centers, compared with 38% in Westchester; and 49% attend Jewish cultural events, compared with 54% in Westchester. The proportion that has been to Israel in this area (48%) is comparable to Westchester (51%) and overall rates (49%); however, Jewish residents of Westchester s Sound Shore Communities demonstrate lower levels of subjective Jewish identity, including lower levels that say being Jewish is very important to them (46% in the Sound Shore Communities versus 55% in Westchester and 57% overall). Similarly, only 35% indicate that being part of a Jewish community is very important to them, compared with 41% in Westchester and 44% overall. Possibly not coincidentally, among the profiled Westchester areas the Sound Shore Communities has both the lowest percentage of people who report that their close friends are mostly Jewish (35%) and the highest rate of intermarriage (37%). Regarding Jewish ritual behavior, the Sound Shore Communities Jewish respondents are somewhat lower than elsewhere in Westchester, especially regarding the level of Chanukah candlelighting (60% in this area and 71% in Westchester). Jewish respondents in this area are also lower than overall Westchester rates regarding participation in Shabbat meals (42% in this area, 45% in Westchester, and 46% overall) and the proportion of people who keep kosher (16% in this area, 20% in Westchester, and 32% overall). That people in this area are interested in learning more about Jewish life is reflected by the 26% who state that they wish they knew more about being Jewish, which is higher than both the Westchester and eight-county rates (21% and 22%, respectively). Philanthropy In the Sound Shore Communities, 67% of Jewish households say they contribute to a combination of Jewish and non-jewish causes and 2% contribute exclusively to Jewish organizations. The percentage that contributes exclusively to non-jewish organizations (24%) is identical to the Westchester and eight-county rates. Thirty-six percent of Jewish households in the Sound Shore Communities report contributing to UJA-Federation of New York, which is higher than the eight-county rate (24%) yet about the same as the Westchester rate (35%).
22 WESTCHESTER SOUND SHORE COMMUNITIES 362 Exhibit 45: Sound Shore Communities: Jewish Population Estimates, 2002 and 2011 Population Estimates Jewish Households 7,900 9,200 Jews 19,000 18,900 People in Jewish Households (including non-jews) 22,900 22,900 Number of People in Jewish Households as a All People in Area 14% 14% Exhibit 45a: Sound Shore Communities: Demography and Social Characteristics, 2011 Age Distribution All People in Jewish Households % % % % % Marital Status All Respondents Married 56% Partnered 1% Never Married 19% Separated or Divorced 12% Widowed 12% Households Russian-Speaking Jewish Households 4%
23 WESTCHESTER SOUND SHORE COMMUNITIES 363 Exhibit 45a (continued): Sound Shore Communities: Demography and Social Characteristics, 2011 Household Composition ( Households) Households With Children 17 and Younger Households With Only Adults Households With Seniors 65+ (no children 17 and younger) 33% 31% 36% Annual Household Income Households Under $50,000 20% $50,000 $99,999 33% $100,000 $149,000 17% $150, % Home Ownership Households Own 74% Rent 26% Employment Status by Gender Respondents and Spouses Ages Employed Males* 88% Employed Females* 65% * Includes full-time, part-time, and self-employed.
24 WESTCHESTER SOUND SHORE COMMUNITIES 364 Exhibit 45b: Sound Shore Communities: People In Need, 2011 Subjective Assessment of Household Financial Condition Households Cannot Make Ends Meet or Just Managing 21% Have Enough 36% Have Extra Money or Wealthy 43% Poverty ( Households) Poor: Under 150% of Federal Poverty Guideline Near Poor: Between 150% 250% of Federal Poverty Guideline Above Poverty or Poverty Status Unknown 9% 4% 87% Vulnerable Seniors Senior Households Need Help With Activities of Daily Living 10% Isolated Seniors Seniors in Age Group Ages 65 to 74 Living Alone 21% Ages 75+ Living Alone 49% Seeking Assistance for Human-Service Needs Number of Households* Assistance for Household Member s Serious or Chronic Illness 1,700 Help With Food or Housing 600 Help Finding a Job or Choosing an Occupation 1,500 Services for an Adult With a Disability 1,700 Homecare Services for an Older Adult in the Household <100 Help for a Child With a Physical, Developmental, or Learning Disability or Other Special Needs 500 * We are reporting absolute numbers rather than percentages for this variable because, due to filtering, the information is based on a small amount of data and we believe that local areas are most interested in actual numbers.
25 WESTCHESTER SOUND SHORE COMMUNITIES 365 Exhibit 45c: Sound Shore Communities: Jewish Engagement, Connections, and Education, 2011 Denomination ( Respondents) Orthodox Conservative Reform Nondenominational Just Jewish Secular, No Religion, and Other 2% 9% 22% 26% 41% Jewish Affiliations and Participation Percent Synagogue Member, Anyone in Household 44% JCC: Anyone in Household Went to a Program in Past Year 34% Jewish Organization, Belong/Regularly Participate, Anyone in Household 21% Jewish Museum or Jewish Cultural Event, Respondent Went in Past Year 49% Respondent Has Ever Traveled to Israel 48% Respondent Feels Very Attached to Israel 38% Respondent s Closest Friends Are Mostly Jewish 35% Feeling Connected Respondents Being Jewish Is Very Important 46% Being Part of Jewish Community Is Very Important 35% Feels Part of a Jewish Community A Lot 32% Wish Knew More About Being Jewish 26% Jewish-Engagement Level* Percent High 28% Moderate 34% Low 39% * See page 349 for a description of the Index of Jewish Engagement and definitions of high, moderate, and low scores.
26 WESTCHESTER SOUND SHORE COMMUNITIES 366 Exhibit 45c (continued): Sound Shore Communities: Jewish Engagement, Connections, and Education, 2011 Jewish Practices and Behaviors Percent Household Member Attends Seder Usually + Always 70% Chanukah Candles Lit in Household Usually + Always 60% Yom Kippur, Respondent Fasts All Day 60% Sabbath Candles Lit Friday Night in Household Usually + Always 18% Kosher Household 16% Shabbat Meal, Respondent Participates Sometimes + Regularly 42% Respondent Talks Regularly About Jewish-Related Topics With Jewish Friends 29% Respondent Studies Informally, Alone, With Friend, or With Teacher 41% Jewish Education Jewish Children Ages 5 17 Day School Current or Previous 9% Supplemental School Current or Previous 58% Tutoring or Other Type of Jewish Education Current or Previous 27% None Ever 6% Number of Jewish Children Ages 0 4** Jewish Preschool or Daycare Program 200 ** We are reporting absolute numbers rather than percentages for this variable because, due to filtering, the information is based on a small amount of data and we believe that local areas are most interested in actual numbers. In-Married and Intermarried Households Married Couples In-Married (including conversionary marriages) 63% Intermarried 37%
27 WESTCHESTER SOUND SHORE COMMUNITIES 367 Exhibit 45d: Sound Shore Communities: Philanthropy and Volunteering, 2011 Charitable Giving ( Households) Both Jewish and Non-Jewish Gifts Jewish Gifts Only Non-Jewish Gifts Only No Charitable Gift 2% 7% 24% 67% Giving to UJA-Federation of New York Households Contributed to UJA-Federation 36% All Respondents Volunteering Who Volunteer* Both Jewish and Non-Jewish Organizations 50% Jewish Organizations Only 2% Non-Jewish Organizations Only 48% * Asked only of respondents who said they volunteered their time for any type of charitable organization. See exhibit B-26 on page 424 for the total percent that volunteered within this area.

28 WESTCHESTER RIVER TOWNS 368 RIVER TOWNS Demography and Social Characteristics The River Towns includes Ardsley, Tarrytown, Irvington, Hastings on Hudson, and Yonkers. In this area, there are 13,700 Jewish households in which 37,100 people reside, of whom 30,800 are Jews. The area s Jewish density is 13%. Since 2002, this area has experienced substantial growth (19%) in its Jewish population. 58 Individuals under age 18 compose 17% of those residing in Jewish households in the area, the smallest proportion of children among the profiled Westchester areas; seniors compose 21% of Jewish household residents. People in Need The River Towns is an economically successful area, though possibly slightly less prosperous than some of the other Westchester Jewish communities. More than half (53%) of the Jewish households in this area have annual incomes exceeding $100,000 and 22% have annual incomes of less than $50,000; both of these proportions are equivalent to the Westchester rates. Nine percent of households are poor, which is slightly higher than the Westchester rate (7%) yet much lower than the overall regional rate (19%). 58 Comparisons in this narrative are based on recalculations of the 2002 data to reflect the 2011 ZIP code groupings.
29 WESTCHESTER RIVER TOWNS 369 Home ownership in the River Towns (75%) is below the Westchester average (83%). Employment among men in the River Towns (70%) is the lowest among men in any of the suburban areas and lower than the eight-county average for men (80%); in contrast, the employment rate for women in the River Towns is above average (78% in River Towns and 71% overall). In this area, 44% of those ages 75 and over live alone, which is below the eight-county rate. Jewish Engagement, Connections, and Education In the River Towns, 39% of Jewish respondents identify as Reform, 26% identify as Conservative, and 7% identify as Orthodox. On several measures of Jewish connection, River Towns Jewish residents are the second highest in Westchester (after South-Central Westchester), including synagogue membership (51%), Jewish community center participation (35%), and Jewish cultural attendance (61%). However, only 51% of River Towns Jewish respondents state that being Jewish is very important to them, compared with 55% in Westchester and 57% overall, and the proportion that indicates being part of a Jewish community is very important to them (38%) is lower than both the Westchester and the overall rates. Only 42% indicate that most of their close friends are Jewish, compared with 48% in Westchester and 52% overall. This area has the lowest level of having visited Israel (38%) among the four profiled Westchester communities. Compared with the overall Westchester averages, Jewish residents of the River Towns have slightly higher or equivalent rates of Jewish ritual behavior, including fasting on Yom Kippur (61% in the River Towns compared with 57% overall in Westchester), participating in a Shabbat meal (48% in the River Towns compared with 45% overall in Westchester), and keeping kosher (20% in the River Towns compared with 20% Westchester). A third (33%) of River Towns marriages are intermarriages, which is higher than both the Westchester and overall rates (28% and 22%, respectively). Philanthropy The River Towns is characterized by a high rate of overall giving (96%) and also one of the higher rates of giving exclusively to non-jewish causes (28%) in the eight-county area; 66% of the area s Jewish households donate to a combination of Jewish and non-jewish causes and 2% donate exclusively to Jewish causes. Thirty-eight percent of households say they give to UJA-Federation of New York, which is slightly higher than the overall Westchester rate (35%) and higher than the overall eight-county rate (24%).
30 WESTCHESTER RIVER TOWNS 370 Exhibit 46: River Towns: Jewish Population Estimates, 2002 and 2011 Population Estimates Jewish Households 13,300 13,700 Jews 25,800 30,800 People in Jewish Households (including non-jews) 31,800 37,100 People in Jewish Households as a All People in Area 11% 13% Exhibit 46a: River Towns: Demography and Social Characteristics, 2011 Age Distribution All People in Jewish Households % % % % % Marital Status All Respondents Married 65% Partnered 8% Never Married 12% Separated or Divorced 7% Widowed 8% Households Russian-Speaking Jewish Households 2%
31 WESTCHESTER RIVER TOWNS 371 Exhibit 46a (continued): River Towns: Demography and Social Characteristics, 2011 Household Composition ( Households) Households With Children 17 and Younger Households With Only Adults Households With Seniors 65+ (no children 17 and younger) 25% 39% 35% Annual Household Income Households Under $50,000 22% $50,000 $99,999 25% $100,000 $149,000 28% $150, % Home Ownership Households Own 75% Rent 25% Employment Status by Gender Respondents and Spouses Ages Employed Males* 70% Employed Females* 78% * Includes full-time, part-time, and self-employed.
32 WESTCHESTER RIVER TOWNS 372 Exhibit 46b: River Towns: People In Need, 2011 Subjective Assessment of Household Financial Condition Households Cannot Make Ends Meet or Just Managing 27% Have Enough 37% Have Extra Money or Wealthy 36% Poverty ( Households) Poor: Under 150% of Federal Poverty Guideline Near Poor: Between 150% 250% of Federal Poverty Guideline Above Poverty or Poverty Status Unknown 9% 8% 83% Vulnerable Seniors Senior Households Need Help With Activities of Daily Living 12% Isolated Seniors Seniors in Age Group Ages 65 to 74 Living Alone 11% Ages 75+ Living Alone 44% Seeking Assistance for Human-Service Needs Number of Households* Assistance for Household Member s Serious or Chronic Illness 2,400 Help With Food or Housing 600 Help Finding a Job or Choosing an Occupation 2,000 Services for an Adult With a Disability 1,800 Homecare Services for an Older Adult in the Household 700 Help for a Child With a Physical, Developmental, or Learning Disability or Other Special Needs 700 * We are reporting absolute numbers rather than percentages for this variable because, due to filtering, the information is based on a small amount of data and we believe that local areas are most interested in actual numbers.
33 WESTCHESTER RIVER TOWNS 373 Exhibit 46c: River Towns: Jewish Engagement, Connections, and Education, 2011 Denomination ( Respondents) Orthodox Conservative Reform Nondenominational Just Jewish Secular, No Religion, and Other 7% 26% 11% 18% 39% Jewish Affiliations and Participation Percent Synagogue Member, Anyone in Household 51% JCC: Anyone in Household Went to a Program in Past Year 35% Jewish Organization, Belong/Regularly Participate, Anyone in Household 29% Jewish Museum or Jewish Cultural Event, Respondent Went in Past Year 61% Respondent Has Ever Traveled to Israel 38% Respondent Feels Very Attached to Israel 36% Respondent s Closest Friends Are Mostly Jewish 42% Feeling Connected Respondents Being Jewish Is Very Important 51% Being Part of Jewish Community Is Very Important 38% Feels Part of a Jewish Community A Lot 31% Wish Knew More About Being Jewish 24% Jewish-Engagement Level* Percent High 38% Moderate 32% Low 31% * See page 349 for a description of the Index of Jewish Engagement and definitions of high, moderate, and low scores.
34 WESTCHESTER RIVER TOWNS 374 Exhibit 46c (continued): River Towns: Jewish Engagement, Connections, and Education, 2011 Jewish Practices and Behaviors Percent Household Member Attends Seder Usually + Always 81% Chanukah Candles Lit in Household Usually + Always 79% Yom Kippur, Respondent Fasts All Day 61% Sabbath Candles Lit Friday Night in Household Usually + Always 20% Kosher Household 20% Shabbat Meal, Respondent Participates Sometimes + Regularly 48% Respondent Talks Regularly About Jewish-Related Topics With Jewish Friends 42% Respondent Studies Informally, Alone, With Friend, or With Teacher 39% Jewish Education Jewish Children Ages 5 17 Day School Current or Previous 16% Supplemental School Current or Previous 67% Tutoring or Other Type of Jewish Education Current or Previous 3% None Ever 15% Number of Jewish Children Ages 0 4** Jewish Preschool or Daycare Program 100 ** We are reporting absolute numbers rather than percentages for this variable because, due to filtering, the information is based on a small amount of data and we believe that local areas are most interested in actual numbers. In-Married and Intermarried Households Married Couples In-Married (including conversionary marriages) 67% Intermarried 33%
35 WESTCHESTER RIVER TOWNS 375 Exhibit 46d: River Towns: Philanthropy and Volunteering, 2011 Charitable Giving ( Households) Both Jewish and Non-Jewish Gifts Jewish Gifts Only Non-Jewish Gifts Only No Charitable Gift 2% 4% 28% 66% 0 10 Giving to UJA-Federation of New York Households Contributed to UJA-Federation 38% All Respondents Volunteering Who Volunteer* Both Jewish and Non-Jewish Organizations 52% Jewish Organizations Only 5% Non-Jewish Organizations Only 43% * Asked only of respondents who said they volunteered their time for any type of charitable organization. See exhibit B-26 on page 424 for the total percent that volunteered within this area.

36 WESTCHESTER NORTH-CENTRAL AND NORTHWESTERN WESTCHESTER 376 NORTH-CENTRAL AND NORTHWESTERN WESTCHESTER Demography and Social Characteristics North-Central and Northwestern Westchester includes Mt. Kisco, Chappaqua, Armonk, Bedford, and Pleasantville. In this area, there are 10,000 Jewish households in which 32,400 people reside, of whom 25,400 are Jews. North-Central and Northwestern Westchester s Jewish density is 23%. Since 2002, the Jewish population in this area has experienced a substantial (23%) decrease. 59 Twenty-one percent of the residents of Jewish households in this area are under age 18 and only 15% are ages 65 and over. In terms of household structure, 32% contain a child and 30% are senior households, the smallest proportion of senior households among the Westchester areas. Sixty-seven percent are married or partnered and 22% have never been married, a slightly higher proportion than in Westchester (16%) and higher than overall in the eight-counties (21%). 59 Comparisons in this narrative are based on recalculations of the 2002 data to reflect the 2011 ZIP code groupings.
37 WESTCHESTER NORTH-CENTRAL AND NORTHWESTERN WESTCHESTER 377 People in Need North-Central and Northwestern Westchester is the most well-off of the profiled Westchester areas and, in fact, is the most affluent area in the eight-county region. It has a higher proportion of households with annual incomes in excess of $100,000 (61%) than any other area and, inversely, the lowest proportion of households with annual incomes of under $50,000 (10%). Ninety-seven percent own their own homes also the highest in the eight-county area. Only 2% of North-Central and Northwestern Westchester s households are poor, substantially below the eight-county average (19%). In this area, men are employed at a rate above the average (88% in this area compared with 80% overall) and women are employed at a slightly higher-than-average rate (75% in this area compared with 71% overall). Jewish Engagement, Connections, and Education Of the Westchester areas, North-Central and Northwestern Westchester has the highest proportion of Reform-identified respondents (53%) and also a very high proportion that identify as secular or having no religion (23%). In general, this area is lower on formal and informal measures of Jewish connection than overall Westchester and lower than overall in the eight-county area. In terms of its level of Jewish cultural attendance, this area is comparable to Westchester (53% in this area and 54% in Westchester) and higher than overall in the eight-counties (49%). Otherwise, North-Central and Northwestern Westchester is lower on synagogue membership (46%), participation at Jewish community centers (26%), and having visited Israel (42%) than overall in Westchester. North-Central and Northwestern Westchester s Jewish residents also have lower levels of subjective Jewish identification than elsewhere: only 43% state that being Jewish is very important to them (compared with 55% overall in Westchester) and only 30% indicate that being part of a Jewish community is very important to them (compared with 41% in Westchester). Finally, 44% said that most of their close friends are Jewish, which is lower than both the local and regional rates (48% and 52%, respectively). Twenty-six percent of marriages in this area are intermarriages, which is comparable to the Westchester rate (28%) and higher than the eight-county rate (22%). Philanthropy Among the Westchester-area profiles, North-Central and Northwestern Westchester has the lowest overall level of philanthropic giving and also the lowest level of Jewish giving. Overall, 86% of the Jewish households in this area give charitable contributions. Fifty-nine percent contribute to a combination of Jewish and non-jewish charities and less than 1% contributes exclusively to Jewish causes; 27% contribute exclusively to non-jewish causes. Although it is the most affluent area in the eight-county region, North-Central and Northwestern Westchester by far has the lowest level of reported giving to UJA-Federation of New York (27%) among the Westchester areas, although this level is slightly higher than the eight-county rate (24%).
38 WESTCHESTER NORTH-CENTRAL AND NORTHWESTERN WESTCHESTER 378 Exhibit 47: North-Central and Northwestern Westchester: Jewish Population Estimates, 2002 and 2011 Population Estimates Jewish Households 12,100 10,000 Jews 32,700 25,400 People in Jewish Households (including non-jews) 41,000 32,400 People in Jewish Households as a All People in Area 30% 23% Exhibit 47a: North-Central and Northwestern Westchester: Demography and Social Characteristics, 2011 Age Distribution All People in Jewish Households % % % % 75+ 9% Marital Status All Respondents Married 65% Partnered 2% Never Married 22% Separated or Divorced 4% Widowed 7% Households Russian-Speaking Jewish Households 1%
39 WESTCHESTER NORTH-CENTRAL AND NORTHWESTERN WESTCHESTER 379 Exhibit 47a (continued): North-Central and Northwestern Westchester: Demography and Social Characteristics, 2011 Household Composition ( Households) Households With Children 17 and Younger Households With Only Adults Households With Seniors 65+ (no children 17 and younger) 32% 38% 30% Annual Household Income Households Under $50,000 10% $50,000 $99,999 29% $100,000 $149,000 25% $150, % Home Ownership Households Own 97% Rent 3% Employment Status by Gender Respondents and Spouses Ages Employed Males* 88% Employed Females* 75% * Includes full-time, part-time, and self-employed.
40 WESTCHESTER NORTH-CENTRAL AND NORTHWESTERN WESTCHESTER 380 Exhibit 47b: North-Central and Northwestern Westchester: People In Need, 2011 Subjective Assessment of Household Financial Condition Households Cannot Make Ends Meet or Just Managing 25% Have Enough 30% Have Extra Money or Wealthy 45% Poverty ( Households) Poor: Under 150% of Federal Poverty Guideline Near Poor: Between 150% 250% of Federal Poverty Guideline Above Poverty or Poverty Status Unknown 2% 1% 97% Vulnerable Seniors Senior Households Need Help With Activities of Daily Living 23% Isolated Seniors Seniors in Age Group Ages 65 to 74 Living Alone 32% Ages 75+ Living Alone 46% Seeking Assistance for Human-Service Needs Number of Households* Assistance for Household Member s Serious or Chronic Illness 1,200 Help With Food or Housing 200 Help Finding a Job or Choosing an Occupation 2,600 Services for an Adult With a Disability 2,000 Homecare Services for an Older Adult in the Household 200 Help for a Child With a Physical, Developmental, or Learning Disability or Other Special Needs 800 * We are reporting absolute numbers rather than percentages for this variable because, due to filtering, the information is based on a small amount of data and we believe that local areas are most interested in actual numbers.
41 WESTCHESTER NORTH-CENTRAL AND NORTHWESTERN WESTCHESTER 381 Exhibit 47c: North-Central and Northwestern Westchester: Jewish Engagement, Connections, and Education, 2011 Denomination ( Respondents) Orthodox Conservative Reform Nondenominational Just Jewish Secular, No Religion, and Other 1% 14% 9% 23% 53% Jewish Affiliations and Participation Percent Synagogue Member, Anyone in Household 46% JCC: Anyone in Household Went to a Program in Past Year 26% Jewish Organization, Belong/Regularly Participate, Anyone in Household 14% Jewish Museum or Jewish Cultural Event, Respondent Went in Past Year 53% Respondent Has Ever Traveled to Israel 42% Respondent Feels Very Attached to Israel 30% Respondent s Closest Friends Are Mostly Jewish 44% Feeling Connected Respondents Being Jewish Is Very Important 43% Being Part of Jewish Community Is Very Important 30% Feels Part of a Jewish Community A Lot 29% Wish Knew More About Being Jewish 10% Jewish-Engagement Level* Percent High 30% Moderate 29% Low 41% * See page 349 for a description of the Index of Jewish Engagement and definitions of high, moderate, and low scores.
JEWISH COMMUNITY STUDY OF NEW YORK: 2011 COMPREHENSIVE REPORT. Overview
 JEWISH COMMUNITY STUDY OF NEW YORK: 2011 COMPREHENSIVE REPORT Overview 1 THE RESEARCH TEAM Jewish Policy and Action Research (JPAR) Comprehensive Report Authors Steven M. Cohen, Ph.D., Research Team Director
ABOUT THE STUDY Study Goals
 ABOUT THE STUDY ABOUT THE STUDY 2014 Study Goals 1. Provide a database to inform policy and planning decisions in the St. Louis Jewish community. 2. Estimate the number of Jewish persons and Jewish households
The Changing Jewish Community: Considerations for Reform Congregations in Long Island and Queens
 The Changing Jewish Community: Considerations for Reform Congregations in Long Island and Queens Based upon data from the Jewish Community Study of New York: 2002 Jennifer Rosenberg UJA-Federation of New
Major Themes of This Study
 Major Themes of This Study A Slowly Growing Community 17,500 persons live in 8,800 Jewish households in Sarasota-Manatee. Of the 17,500 persons, 89% (15,500 persons) are Jewish. The number of Jewish households
East Bay Jewish Community Study 2011
 East Bay Jewish Community Study 2011 Demographic Survey Executive Summary Facilitated by Greenberg Quinlan Rosner Research Executive Summary The Jewish Community of the East Bay is imbued with a rich array
Multiple Streams: Diversity Within the Orthodox Jewish Community in the New York Area
 Multiple Streams: Diversity Within the Orthodox Jewish Community in the New York Area Jacob B. Ukeles, Ph.D. December 17, 2012 Association for Jewish Studies 44th Annual Conference Outline 2 Introduction
What We Learned from the 2011 Passover-Easter Survey By Edmund Case
 What We Learned from the 2011 Passover-Easter Survey By Edmund Case Abstract Deciding how to celebrate Passover and Easter is one of the key potential conflicts in interfaith families. In February 2011,
JEWISH EDUCATIONAL BACKGROUND: TRENDS AND VARIATIONS AMONG TODAY S JEWISH ADULTS
 JEWISH EDUCATIONAL BACKGROUND: TRENDS AND VARIATIONS AMONG TODAY S JEWISH ADULTS Steven M. Cohen The Hebrew University of Jerusalem Senior Research Consultant, UJC United Jewish Communities Report Series
The 2018 Jewish Federation of Metropolitan Detroit Population Study: A Portrait of the Detroit Community
 1 The 2018 Jewish Federation of Metropolitan Detroit Population Study: A Portrait of the Detroit Community Jewish Education Congregational Schools Ira M. Sheskin, Ph.D. Director of the Jewish Demography
The 2007 Jewish Community Study of the Lehigh Valley. Main Report Volume I: Chapters 1-7
 The 2007 Jewish Community Study of the Lehigh Valley Main Report Volume I: Chapters 1-7 Ira M. Sheskin, Ph.D. Director of the Jewish Demography Project of the Sue and Leonard Miller Center for Contemporary
2016 GREATER HOUSTON JEWISH COMMUNITY STUDY
 2016 GREATER HOUSTON JEWISH COMMUNITY STUDY Initial Report December 20161 Geographic Areas of Houston Zip Code Numbers without 77 and without leading zeros Example: The 24 on the map is 77024 382 North
Jewish Community Study
 1 The 2008 Greater Middlesex Jewish Community Study Ira M. Sheskin, Ph.D. Director of the Jewish Demography Project of the Sue and Leonard Miller Center for Contemporary Judaic Studies and Associate Professor,
The 2017 Indianapolis Jewish Population Study: A Portrait of the Indianapolis Jewish Community
 The 2017 Indianapolis Jewish Population Study: A Portrait of the Indianapolis Jewish Community Main Report Volume II, Chapters 8-15 Ira M. Sheskin Professor and Chair Department of Geography University
Jewish Community Study
 1 The 2008 Greater Middlesex Jewish Community Study Ira M. Sheskin, Ph.D. Director of the Jewish Demography Project of the Sue and Leonard Miller Center for Contemporary Judaic Studies and Associate Professor,
The 2018 Jewish Federation of Metropolitan Detroit Population Study: Twelve Major Findings
 1 The 2018 Jewish Federation of Metropolitan Detroit Population Study: Twelve Major Findings Ira M. Sheskin, Ph.D. Director of the Jewish Demography Project of the Sue and Leonard Miller Center for Contemporary
Jewish College Students
 National Jewish Population Survey 2000-01 Jewish College Students A United Jewish Communities Presentation of Findings to Hillel: The Foundation for Jewish Campus Life January 2004 NJPS Respondents The
THE ALUMNI OF YOUNG JUDAEA: A LONG-TERM PORTRAIT OF JEWISH ENGAGEMENT
 THE ALUMNI OF YOUNG JUDAEA: A LONG-TERM PORTRAIT OF JEWISH ENGAGEMENT SURVEY FIELDED: JUNE 18, 2017 OCTOBER 18, 2017 REPORT PUBLISHED: MARCH 1, 2018 Prof. Steven M. Cohen Hebrew Union College-Jewish Institute
Conservative Judaism A Sociodemographic Overview of Conservative Jewry in the Metropolitan New York Area David M. Pollock Jewish Community Relations
 Conservative Judaism A Sociodemographic Overview of Conservative Jewry in the Metropolitan New York Area David M. Pollock Community Relations Council of New York Data sources National data are from the
Greater Seattle Jewish Community Study
 OF GREATER SEATTLE 2014 Greater Seattle Jewish Community Study SECTION P: Synagogue Members Research conducted by: Matthew Boxer, Janet Krasner Aronson Matthew A. Brown, Leonard Saxe Cohen Center for Modern
January Parish Life Survey. Saint Paul Parish Macomb, Illinois
 January 2018 Parish Life Survey Saint Paul Parish Macomb, Illinois Center for Applied Research in the Apostolate Georgetown University Washington, DC Parish Life Survey Saint Paul Parish Macomb, Illinois
The 2002 Pittsburgh Jewish Community Study FINAL REPORT. United Jewish Federation of Greater Pittsburgh. in partnership with the
 The 2002 Pittsburgh Jewish Community Study FINAL REPORT United Jewish Federation of Greater Pittsburgh in partnership with the Jewish Healthcare Foundation Ukeles Associates, Inc. Marketing Systems Group
2018 Detroit Jewish Population Study Summary Report
 2018 Detroit Jewish Population Study Summary Report The 2018 Detroit Jewish Population Study: A Portrait of the Detroit Jewish Community Summary Report Ira M. Sheskin Professor Department of Geography
The Jewish Community Study of New York: 2002 GEOGRAPHIC PROFILE
 The Jewish Community Study of New York: 2002 GEOGRAPHIC PROFILE June 2004 UJA-FEDERATION LEADERSHIP President Larry Zicklin* Chair of the Board Morris W. Offit* Executive Vice President & CEO John S. Ruskay
What We Learned from the 2014 Passover/Easter Survey By InterfaithFamily
 What We Learned from the 2014 Passover/Easter Survey By InterfaithFamily Introduction In March 2014, InterfaithFamily conducted its tenth annual Passover/Easter Survey to determine the attitudes and behaviors
The Portrait. Commissioned and supported by: Jewish Community Federation and Endowment Fund. In cooperation with:
 ACKNOWLEDGMENTS The Portrait Commissioned and supported by: Jewish Community Federation and Endowment Fund Richard Fiedotin, Board Chair Danny Grossman, CEO Julie Golde, Senior Director of Community Impact
What We Learned from the Ninth Annual December Holidays Survey
 What We Learned from the Ninth Annual December Holidays Survey By Edmund Case, CEO Introduction In September October 2011, we conducted our ninth annual December Holidays Survey to determine how people
The American Religious Landscape and the 2004 Presidential Vote: Increased Polarization
 The American Religious Landscape and the 2004 Presidential Vote: Increased Polarization John C. Green, Corwin E. Smidt, James L. Guth, and Lyman A. Kellstedt The American religious landscape was strongly
Report of Findings: Seniors in the Jewish Community Community Presentation March 12, 2014
 Report of Findings: in the Jewish Community Community Presentation March 12, 2014 1528 Walnut Street, Suite 1414, Philadelphia, PA 19102 www.meliorgroup.com Presentation Overview Background Profile Conclusions
College Students. The 2018 Jewish Federation of Metropolitan Detroit Population Study: A Portrait of the Detroit Community
 1 The 2018 Jewish Federation of Metropolitan Detroit Population Study: A Portrait of the Detroit Community College Students Ira M. Sheskin, Ph.D. Director of the Jewish Demography Project of the Sue and
Jewish Life in Greater Toronto
 Jewish Life in Greater Toronto A Survey of the Attitudes & Behaviours of Greater Toronto s Jewish Community By Charles Shahar & Tina Rosenbaum Acknowledgements UJA Federation of Greater Toronto would like
May Parish Life Survey. St. Mary of the Knobs Floyds Knobs, Indiana
 May 2013 Parish Life Survey St. Mary of the Knobs Floyds Knobs, Indiana Center for Applied Research in the Apostolate Georgetown University Washington, DC Parish Life Survey St. Mary of the Knobs Floyds
Jewish Community Study
 1 The 2008 Greater Middlesex Jewish Community Study Ira M. Sheskin, Ph.D. Director of the Jewish Demography Project of the Sue and Leonard Miller Center for Contemporary Judaic Studies and Associate Professor,
Russian American Jewish Experience
 Russian American Jewish Experience RAJE Background & Long Term Impact of the RAJE Fellowship Program Results of the Research Institute for New Americans (RINA) Long Term Impact Study FROM LET MY PEOPLE
A Comparison of Pentecostal and Mainline Churchgoers in Nigeria s South South NPCRC Technical Report #N1106
 A Comparison of and Churchgoers in Nigeria s South South NPCRC Technical Report #N1106 Dr. K. A. Korb 28 November 2012 1 Executive Summary The Nigerian and Charismatic Research Centre collected information
Jewish Community Study
 1 The 2008 Greater Middlesex Jewish Community Study Ira M. Sheskin, Ph.D. Director of the Jewish Demography Project of the Sue and Leonard Miller Center for Contemporary Judaic Studies and Associate Professor,
THE INSTITUTE FOR JEWISH POLICY RESEARCH THE POLITICAL LEANINGS OF BRITAIN S JEWS APRIL 2010
 THE INSTITUTE FOR JEWISH POLICY RESEARCH THE POLITICAL LEANINGS OF BRITAIN S JEWS APRIL 20 About JPR JPR, the Institute for Jewish Policy Research, is a London-based independent research unit and think-tank
August Parish Life Survey. Saint Benedict Parish Johnstown, Pennsylvania
 August 2018 Parish Life Survey Saint Benedict Parish Johnstown, Pennsylvania Center for Applied Research in the Apostolate Georgetown University Washington, DC Parish Life Survey Saint Benedict Parish
Demographic and Attitudinal Survey of the Jewish Population of New Mexico. January 15, 2015
 Demographic and Attitudinal Survey of the Jewish Population of New Mexico January 15, 2015 Introduction Research goals How Jews in New Mexico identify as being Jewish, including denomination and upbringing
OF GREATER SEATTLE PUGET SOUND JEWISH COMMUNITY PROFILE
 OF GREATER SEATTLE 2014 PUGET SOUND JEWISH COMMUNITY PROFILE ACKNOWLEDGEMENTS The Jewish Federation of Greater Seattle thanks the many individuals and organizations who made possible the production of
The 2008 Jewish Community Study of Greater Middlesex County. Summary Report
 The 2008 Jewish Community Study of Greater Middlesex County Summary Report Ira M. Sheskin, Ph.D. Director of the Jewish Demography Project of the Sue and Leonard Miller Center for Contemporary Judaic Studies
A PORTRAIT OF THE INDIANAPOLIS JEWISH COMMUNITY
 A PORTRAIT OF THE INDIANAPOLIS JEWISH COMMUNITY 2017 INDIANAPOLIS JEWISH COMMUNITY STUDY A Portrait of the Indianapolis Jewish Community In your hands is a document that paints a portrait of the Indianapolis
The 2017 Indianapolis Jewish Population Study: A Portrait of the Indianapolis Jewish Community
 The 2017 Indianapolis Jewish Population Study: A Portrait of the Indianapolis Jewish Community Main Report Volume I, Chapters 1-7 Ira M. Sheskin Professor and Chair Department of Geography University of
2009 User Survey Report
 2009 User Survey Report Table of Contents METHODOLOGY... 3 DE MOGRAPHICS... 3 Gender... 3 Religion... 3 Age... 4 Connection to Intermarriage... 5 Other Notable Demographics... 5 W HY DO PEOPLE COME TO
2014 St. Louis Jewish Community Study
 STUDY CONDUCTED BY The 2014 St. Louis Jewish Community Study is a snapshot of Jewish St. Louis. The study helps us understand our strengths, needs and potential by answering questions about the size of
2017 Greater Washington Jewish Community Demographic Study
 2017 Greater Washington Jewish Community Demographic Study Dr. Janet Krasner Aronson Matthew Brookner Dr. Matthew Boxer Prof. Leonard Saxe 11 February 2018 Counting Jews Hosea (2:1) And the number of the
Welfare and Standard of Living
 Welfare and Standard of Living Extent of poverty Marital status Households Monthly expenditure on consumption Ownership of durable goods Housing density Welfare and Standard of Living Extent of Poverty
CHAPTER 7 DIVERSE JEWISH 211 COMMUNITIES
 CHAPTER 7 DIVERSE JEWISH 211 COMMUNITIES As the foregoing chapters have demonstrated, New York Jewry is far from homogenous. Rather, its long history, waves of immigration, social-class differences, geographic
BAY AREA JEWISH LIFE. Community Study Highlights A PORTRAIT OF AND COMMUNITIES. Published February 13, Commissioned and supported by:
 A PORTRAIT OF BAY AREA JEWISH LIFE AND COMMUNITIES Community Study Highlights Published February 13, 2018 Commissioned and supported by: The Jewish Community Federation of San Francisco, the Peninsula,
The 2001 Jewish Community Study of Bergen County and North Hudson. Summary Report
 The 2001 Jewish Community Study of Bergen County and North Hudson Summary Report UJA Federation of Bergen County & North Hudson Ira M. Sheskin, Ph.D. Associate Professor Department of Geography and Fellow
What We Learned from the 2009 Passover/Easter Survey By Micah Sachs
 What We Learned from the 2009 Passover/Easter Survey By Micah Sachs Abstract While the confluence of Passover and Easter is not as culturally prominent as the so-called "December dilemma," deciding how
A community rediscovered. A city revitalized.
 A community rediscovered. A city revitalized. THE JEWISH COMMUNITY OF GREATER NEW ORLEANS COMMUNITY SURVEY 2007 FINAL REPORT EXECUTIVE SUMMARY & KEY RECOMMENDATIONS MAY 2008 Frederick Weil Department of
Center for Applied Research in the Apostolate
 Special Report: Parish Life Today About CARA CARA is a national, non-profit, Georgetown University affiliated research center that conducts social scientific studies about the Catholic Church. Founded
A Comprehensive Study of The Frum Community of Greater Montreal
 A Comprehensive Study of The Frum Community of Greater Montreal The following is a comprehensive study of the Frum Community residing in the Greater Montreal Metropolitan Area. It was designed to examine
Britain s Jewish Community Statistics 2010
 Britain s Jewish Community Statistics 2010 Daniel Vulkan Board of Deputies of British Jews April 2012 Contents Executive summary... 3 Introduction... 5 Births... 6 Marriages... 9 Divorces... 13 Deaths...
Hispanic Members of the Presbyterian Church (U.S.A.): Survey Results
: Survey Results") Hispanic Members of the Presbyterian Church (U.S.A.): Survey Results Teresa Chávez Sauceda May 1999 Research Services A Ministry of the General Assembly Council Presbyterian Church (U.S.A.) 100 Witherspoon
Hispanic Members of the Presbyterian Church (U.S.A.): Survey Results Teresa Chávez Sauceda May 1999 Research Services A Ministry of the General Assembly Council Presbyterian Church (U.S.A.) 100 Witherspoon
FACTS About Non-Seminary-Trained Pastors Marjorie H. Royle, Ph.D. Clay Pots Research April, 2011
 FACTS About Non-Seminary-Trained Pastors Marjorie H. Royle, Ph.D. Clay Pots Research April, 2011 This report is one of a series summarizing the findings of two major interdenominational and interfaith
Jury Service: Is Fulfilling Your Civic Duty a Trial?
 Jury Service: Is Fulfilling Your Civic Duty a Trial? Prepared for: The American Bar Association July 2004 Table of Contents Page Background and Methodology 3 Executive Summary 4 Detailed Findings 7 Respondent
2017 Greater Washington Jewish Community Demographic Study
 2017 Greater Washington Jewish Community Demographic Study Children and Jewish Education Dr. Janet Krasner Aronson Matthew Brookner Dr. Matthew Boxer Prof. Leonard Saxe 11 February 2018 Counting Jews Hosea
Volunteerism. among American Jews. Laurence Kotler-Berkowitz Miriam Rieger United Jewish Communities
 United Jewish Communities Report Series on the National Jewish Population Survey 2000-01 Volunteerism among American Jews 9 Laurence Kotler-Berkowitz Miriam Rieger FEBRUARY 2005 report United Jewish Communities
Recoding of Jews in the Pew Portrait of Jewish Americans Elizabeth Tighe Raquel Kramer Leonard Saxe Daniel Parmer Ryan Victor July 9, 2014
 Recoding of Jews in the Pew Portrait of Jewish Americans Elizabeth Tighe Raquel Kramer Leonard Saxe Daniel Parmer Ryan Victor July 9, 2014 The 2013 Pew survey of American Jews (PRC, 2013) was one of the
BRITAIN S JEWISH COMMUNITY STATISTICS 2007
 REPORT OF THE COMMUNITY RESEARCH UNIT BOARD OF DEPUTIES OF BRITISH JEWS BRITAIN S JEWISH COMMUNITY STATISTICS 2007 By DAVID GRAHAM & DANIEL VULKAN Issued November 2008 Table of Contents Summary of Key
jpr / Pesach 5774 / April 2014
 jpr/data night Make your seder night different from all other seder nights April 14 jpr / Pesach 5774 / April 14 Institute for Jewish Policy Research Data night Four questions to make your seder night
Union for Reform Judaism. URJ Youth Alumni Study: Final Report
 Union for Reform Judaism URJ Youth Alumni Study: Final Report February 2018 Background and Research Questions For more than half a century, two frameworks have served the Union for Reform Judaism as incubators
April Parish Life Survey. Saint Elizabeth Ann Seton Parish Las Vegas, Nevada
 April 2017 Parish Life Survey Saint Elizabeth Ann Seton Parish Las Vegas, Nevada Center for Applied Research in the Apostolate Georgetown University Washington, DC Parish Life Survey Saint Elizabeth Ann
The Fifth National Survey of Religion and Politics: A Baseline for the 2008 Presidential Election. John C. Green
 The Fifth National Survey of Religion and Politics: A Baseline for the 2008 Presidential Election John C. Green Ray C. Bliss Institute of Applied Politics University of Akron (Email: green@uakron.edu;
AMERICAN JEWISH OPINION
 1997 ANNUAL SURVEY OF AMERICAN JEWISH OPINION Conducted for the American Jewish Committee by Market Facts, Inc. February 3-11, 1997 The American Jewish Committee The Jacob Blaustein Building 165 East 56th
SAINT ANNE PARISH. Parish Survey Results
 SAINT ANNE PARISH Parish Survey Results Stewardship Committee 3/1/2015 Executive Summary Survey Representation Based on counts made during the months of May and September, 2014, the average number of adults
Executive Summary Clergy Questionnaire Report 2015 Compensation
 45 th Anniversary of the Ordination of Women Executive Summary Clergy Questionnaire Report 2015 Research and Evaluation, Office of the Presiding Bishop Evangelical Lutheran Church in America Kenneth W.
Maungakiekie-Tāmaki Local Board Profile. - Initial results from the 2013 Census. February 2014
 Maungakiekie-Tāmaki Local Board Profile - Initial results from the 2013 Census February 2014 Social and Economic Research Team Research, Investigations and Monitoring Unit Auckland Council Map of Maungakiekie-Tāmaki
Faith Communities Today
 Faith Communities Today UU Survey Results Analyzed By The Reverend Charlotte Cowtan January, 2002 Faith Communities Today Page 1 Introduction Early in the year 2000, Faith Community Today survey was sent
INTRODUCTION. Vital-ARe-We-4.pdf, or by ing
 INTRODUCTION FACTS about Local and Global Mission Programs and Giving A Report of UCC Results from the FACT Study Marjorie H. Royle, Ph.D. Clay Pots Research November, 2011 This report is one in a series
Churchgoers Views Strength of Ties to Church. Representative Survey of 1,010 American Churchgoers
 Churchgoers Views Strength of Ties to Church Representative Survey of 1,010 American Churchgoers 2 Methodology LifeWay Research conducted the study August 22 30, 2017. The survey was conducted using the
The Reform and Conservative Movements in Israel: A Profile and Attitudes
 Tamar Hermann Chanan Cohen The Reform and Conservative Movements in Israel: A Profile and Attitudes What percentages of Jews in Israel define themselves as Reform or Conservative? What is their ethnic
PJ Library Impact Evaluation
 PJ Library Impact Evaluation UNITED STATES AND CANADA JUNE 2017 PJ LIBRARY IMPACT EVALUATION 1 In just 12 years, PJ Library has delivered more than 10 million books to families raising Jewish children
MEMBER ENGAGEMENT SURVEY RESULTS
 MEMBER ENGAGEMENT SURVEY RESULTS For more than 70 years, Gallup has been developing instruments that measure the "unmeasurable." Gallup has created tools that accurately measure the soft numbers including
THE BRETHREN: An Investigation into Marriage and Family Relations Among the Plymouth Brethren (Exclusive Brethren) in Australia
 in Australia") THE BRETHREN: An Investigation into Marriage and Family Relations Among the Plymouth Brethren (Exclusive Brethren) in Australia Gary D Bouma, BA, BD, MA, PhD Professor of Sociology UNESCO Chair in Interreligious
THE BRETHREN: An Investigation into Marriage and Family Relations Among the Plymouth Brethren (Exclusive Brethren) in Australia Gary D Bouma, BA, BD, MA, PhD Professor of Sociology UNESCO Chair in Interreligious
Cohen Center for Modern Jewish Studies. Jewish Futures Study. Survey Instrument
 Cohen Center for Modern Jewish Studies Jewish Futures Study Survey Instrument Summer 2010 Contents BRILT Follow up New Respondents... 2 Thinking about Israel... 2 Your views... 4 Your Upbringing... 5 About
Survey Report New Hope Church: Attitudes and Opinions of the People in the Pews
 Survey Report New Hope Church: Attitudes and Opinions of the People in the Pews By Monte Sahlin May 2007 Introduction A survey of attenders at New Hope Church was conducted early in 2007 at the request
Churchgoers Views - Tithing. Representative Survey of 1,010 American Churchgoers
 Churchgoers Views - Tithing Representative Survey of 1,010 American Churchgoers 2 Methodology LifeWay Research conducted the study August 22 30, 2017. The survey was conducted using the web-enabled KnowledgePanel,
The 2008 Cincinnati Jewish Community Study. Ukeles Associates, Inc. (UAI) Jacob B. Ukeles, Ph.D., President Ron Miller, Ph.D., Research Director
 Jacob B. Ukeles, Ph.D., President Ron Miller, Ph.D., Research Director") 1 The Ukeles Associates, Inc. (UAI) Jacob B. Ukeles, Ph.D., President Ron Miller, Ph.D., Research Director Updated October 3, 2008 2 CONTENTS About the Jewish Community Study The Big Stories Jewish Population
1 The Ukeles Associates, Inc. (UAI) Jacob B. Ukeles, Ph.D., President Ron Miller, Ph.D., Research Director Updated October 3, 2008 2 CONTENTS About the Jewish Community Study The Big Stories Jewish Population
Jewish Population of Broward County
 1 Jewish Population of County Ira M. Sheskin, Ph.D. Director of the Jewish Demography Project of the Sue and Leonard Miller Center for Contemporary Judaic Studies and Associate Professor, Department of
MEMBER ENGAGEMENT SURVEY RESULTS
 MEMBER ENGAGEMENT SURVEY RESULTS For more than 70 years, Gallup has been developing instruments that measure the "unmeasurable." Gallup has created tools that accurately measure the soft numbers including
HIGHLIGHTS. Demographic Survey of American Jewish College Students 2014
 HIGHLIGHTS Demographic Survey of American Jewish College Students 2014 Ariela Keysar and Barry A. Kosmin Trinity College, Hartford, Connecticut The national online Demographic Survey of American College
Their Numbers, Characteristics, and Patterns of Jewish Engagement
 Their Numbers, Characteristics, and Patterns of Jewish Engagement A UJA-Federation of New York Report March 2009 Professor Steven M. Cohen Dr. Judith Veinstein UJA-Federation of New York Leadership President
PRESENTS. 5/30/2013 Bates Staff Retreat 1
 PRESENTS 1 Bates Leadership Team ASSESSMENT OUTCOMES Presented by Lisa Lee Williams, MaOM, Mdiv. Why Are We Here? To Celebrate Success To Consider Opportunities To Creatively Move Forward! 4 5 6 8 9 Your
Transition Summary and Vital Leader Profile. The Church Assessment Tool 5/3/16
 Transition Summary and Vital Leader Profile generated from The Church Assessment Tool 5/3/16 "And this is my prayer: that your love may abound more and more in knowledge and depth of insight, so that you
Number 1 Young Adult Catholics in the Context of Other Catholic Generations
 Number 1 Young Adult Catholics in the Context of Other Catholic Generations Young Adult Catholics in the Context of Other Catholic Generations: Living with Diversity, Seeking Service, Waiting to be Welcomed
Fruits of Faith. Sword Series Collection of Christian Theological Essays FRUITS OF FAITH
 Fruits of Faith Written by Eric Shuster Founder and Executive Director of the Foundation for Christian Studies One can compare the fruits of youth and adults in various Christian sects in order to understand
Westminster Presbyterian Church Discernment Process TEAM B
 Westminster Presbyterian Church Discernment Process TEAM B Mission Start Building and document a Congregational Profile and its Strengths which considers: Total Membership Sunday Worshippers Congregational
Views on Ethnicity and the Church. From Surveys of Protestant Pastors and Adult Americans
 Views on Ethnicity and the Church From Surveys of Protestant Pastors and Adult Americans Protestant Pastors Views on Ethnicity and the Church Survey of 1,007 Protestant Pastors 3 Methodology The telephone
CHAPTER FOUR RESEARCH FINDINGS. Introduction. D.Min. project. A coding was devised in order to assign quantitative values to each of the
 CHAPTER FOUR RESEARCH FINDINGS Introduction The survey (Appendix C) sent to 950 women alumnae of Dallas Seminary resulted in 377 (41%) valid surveys which were used to compute the results of this D.Min.
Mind the Gap: measuring religiosity in Ireland
 Mind the Gap: measuring religiosity in Ireland At Census 2002, just over 88% of people in the Republic of Ireland declared themselves to be Catholic when asked their religion. This was a slight decrease
Unaffiliated Lay Vincentians' Informal Engagement with the Vincentian Mission
 Via Sapientiae: The Institutional Repository at DePaul University Vincentian Digital Books Vincentian Heritage Collections 6-1-2014 Unaffiliated Lay Vincentians' Informal Engagement with the Vincentian
Survey of Church Members. Minnesota Conference of the Seventh-day Adventist Church 2006 Center for Creative Ministry
 Survey of Church Members Minnesota Conference of the Seventh-day Adventist Church 2006 Center for Creative Ministry Source of Data o A random sample of 34 local churches was selected and telephone interviews
In Our Own Words 2000 Research Study
 The Death Penalty and Selected Factors from the In Our Own Words 2000 Research Study Prepared on July 25 th, 2001 DEATH PENALTY AND SELECTED FACTORS 2 WHAT BRINGS US TOGETHER: A PRESENTATION OF THE IOOW
Basic Church Profile Inventory Sample
 Introduction Basic Church Profile Inventory Sample This is a sample of all the questions contained in Hartford Institute's Church Profile Inventory Survey that can be completed online. A church that chooses
University System of Georgia Survey on Student Speech and Discussion
 University System of Georgia Survey on Student Speech and Discussion May 2008 Conducted for the Board of Regents University System of Georgia by By James J. Bason, Ph.D. Director and Associate Research
How Are Worshipers Involved in the Community?
 How Are Worshipers Involved in the Community? Findings from the U.S. Congregational Life Survey Congregations and worshipers focus on their communities in a wide variety of ways, from helping the poor
Factors related to students focus on God
 The Christian Life Survey 2014-2015 Administration at 22 Christian Colleges tucse.taylor.edu Factors related to students focus on God Introduction Every year tens of thousands of students arrive at Christian
Note: Results are reported by total population sampled; and sub-samples. See final page for details.
 The 11th Biannual Youth Survey on Politics and Public Service Field Dates: October 4 October 16, 2006 Master Questionnaire; N=2,546 18-24 Year Olds Margin of Error: ± 1.9% Note: Results are reported by