Religious affiliation in Greater Western Sydney, 2016 By Amy Lawton, Social Research and Information Officer, WESTIR Limited
|
|
|
- Kristin Nelson
- 5 years ago
- Views:
Transcription
1 Introduction Religious affiliation in Greater Western Sydney, 2016 By Amy Lawton, Social Research and Information Officer, WESTIR Limited The recent release of the 2016 Census has generated much discussion among media outlets, particularly on the topic of religious affiliation. For the first time ever, there were more responses to no religion than any actual religion. In other words, when not stated responses are excluded, a total of 30.1% of the national population self-identified as having no religion, outnumbering Catholics at 22.6%. Overall, the national response to the no religion has increased by 46.9% between 2006 and 2016 (Australian Bureau of Statistics (ABS) 2017). The ABS Census question on religion asks Australians to identify their religion through the question, What is the person s religion?. The ABS Census is the only reliable source of data on religious affiliation in Australia, but it is also an optional question on the Census form. In the 2016 Census, the ABS made an important change to the religion question on the Census form by placing the option for no religion at the top of the answers. The change in the order of responses was undertaken based on trends in how people have answered the religion question in the Census over time. While the reasons for Australians identifying less with religion are largely speculative, Renae Barker of ABC Religion and Ethics Opinion (2017) highlights that: Focusing on this number [the rise of no religion ] without further investigating the story it tells, along with the rest of the Census data, is overly simplistic. It misses the rich and complex relationship we as Australians have with religion and non-belief Calls for a more secular Australia ignore the fact that the majority of Australians are still religious. We may not shout it from the roof tops but for many it is still an important part of our lives The nones [are increasing but] they are not the majority, nor are they the largest single religious group, contrary to what many of the headlines have claimed. A recent study by McCrindle et al (2017) called Faith and Belief in Australia also suggests that the relationship between religion and belief among Australians is multifaceted. The study, which surveyed over 1,000 Australians, reveals that some people who claim to have no religion [in the Census], still consider themselves spiritual, believing in a higher being, principle or power, or have some element of spirituality. Barker (2017) also adds that the Census tells how people self-identify but tells us nothing about how religious (or irreligious) a person is for example, not all those who identified as Christian would regularly attend church, while many people who chose "no religion" in 2016 may well have interacted with organised religion in the past, or may do so in the future. Overall, the Census results remind us of the role of belief (and unbelief) in Australia, particularly at a time where religious viewpoints may influence current legal and policy issues such as same-sex marriage, terrorism, migration and abortion. Nationally, the 2016 Census shows that Christianity is still Australia s most common religion (52.1% of the population), followed by Islam (2.6%), Buddhism (2.4%) and Hinduism (1.9%). Young adults (18 years to 34 years) were more likely to choose no religion (39.4%) than any other adult age groups. In a comparison of states, New South Wales had the highest religious affiliation (65.3%) and Tasmania had the lowest (52.0%). For more information national figures, please see Religion in Australia 2016 Census Data Summary on the ABS website. Regionally, Greater Western Sydney (GWS) is an area of growing national importance and has one of the fastest growing populations in Australia. It is also a region of increasing cultural and linguistic diversity, which is often associated with religious affiliation. 1
2 Aim of this paper The aim of this paper is to explore the religious affiliation of the GWS community, including the prevalence of secularism/no religion and religious affiliation not stated in the area. Definitions in this report Religious categories The general snapshot of religion in GWS will compare the following categories: Christianity, other religions and no religion. Where relevant, the category not stated or inadequately described will also be provided. Christianity includes the total number of Christian denominations, including Catholic, Anglican and other smaller Christian groups. Other religions include Buddhism, Hinduism, Islam, Judaism, Sikhism and other religious groups. Other religious groups comprise of Australian Aboriginal Traditional Religions, Baha'i, Chinese Religions, Druse, Japanese Religions, Nature Religions, Spiritualism and Miscellaneous Religions. No religion includes secular and other spiritual beliefs such as Agnosticism, Atheism, Humanism, Rationalism, New Age, Theism, Pantheism and Unitarian. The general snapshot is followed by a more detailed discussion of religious affiliation in GWS. Regions GWS is made up of the following 13 local government areas (LGAs): Blacktown Blue Mountains Camden Campbelltown Canterbury Bankstown Cumberland Fairfield Hawkesbury Liverpool Parramatta Penrith The Hills Shire Wollondilly This paper also covers two additional LGAs, Lithgow and Wingecarribee, but are not included in GWS totals. GWS is also compared with data for Greater Sydney, Rest of Sydney, FACS Western Sydney district, FACS South Western Sydney district and New South Wales (NSW): Greater Sydney and NSW are compiled from ABS boundaries. Rest of Sydney is calculated by subtracting the totals of Greater Sydney with the totals of GWS. FACS Western Sydney (FACS WS) is made up of Blacktown, Blue Mountains, Cumberland, Hawkesbury, Lithgow, Parramatta, Penrith and The Hills Shire LGAs. FACS South Western Sydney (FACS SWS) is made up of Camden, Campbelltown, Canterbury Bankstown, Fairfield, Liverpool, Wingecarribee and Wollondilly LGAs. All data tables are based on place of usual residence, unless otherwise stated. 2
3 Other religions Christianity Snapshot: Religious affiliation in Greater Western Sydney Type of religious affiliation In 2016, just over 2.1 million people in Greater Western Sydney (GWS) answered the religion question in the Census. A total of 186,981 people did not state a religion, equating to 8.1% of the GWS population. Table 1 and Chart 1 shows the religious affiliation of the GWS community in Christianity was the most common religion reported (53.4% of the population), followed by Islam (9.1%), Hinduism (4.9%) and Buddhism (4.8%). A total of 474,134 people or 20.6% of the GWS population identified with religions other than Christianity. A total of 412,886 people or 17.9% of the GWS population stated that they had no religion in Overall, the GWS community had a higher rate of affiliation with religion and a lower rate of no religion than Greater Sydney, Rest of Sydney and NSW. Religious Affiliation Table 1: Religious affiliation in GWS, 2016 Greater Western Sydney FACS WS District FACS SWS District Greater Sydney Rest of Sydney Number % % % % % % Catholic 622, % 26.5% 27.3% 25.1% 23.5% 24.7% Anglican 248, % 12.2% 10.0% 12.0% 13.2% 15.5% Other Christian 361, % 14.9% 16.6% 14.6% 13.5% 15.0% Total Christianity 1,233, % 53.6% 53.9% 51.7% 50.2% 55.2% Islam 210, % 6.8% 11.3% 5.3% 1.7% 3.6% Hinduism 113, % 6.7% 2.5% 3.5% 2.3% 2.4% NSW Buddhism 110, % 2.5% 7.3% 3.9% 3.0% 2.8% Sikhism 22, % 1.5% 0.3% 0.6% 0.2% 0.4% Judaism 1, % 0.1% 0.0% 0.7% 1.3% 0.5% Other religious groups 15, % 0.5% 0.9% 0.5% 0.3% 0.5% Total other religions 474, % 18.1% 22.3% 14.5% 8.8% 10.2% No religion Not stated 412, % 20.3% 15.6% 25.0% 31.6% 25.5% 186, % 8.1% 8.2% 8.8% 9.5% 9.2% Total 2,307, % 100% 100% 100% 100% 100% Please note that there are small random adjustments made to all cell values to protect the confidentiality of data. These adjustments may cause the sum of rows or columns to differ by small amounts from table totals. (Source: ABS 2017a, Table 12a) 3

4 Chart 1: Religious affiliation in GWS, 2016 (Source: ABS 2017a, Table 12a) Changes over time The religious makeup of GWS has changed over a five to ten-year period (See Table 2 and Chart 2). The proportion of people in GWS identifying with Christianity has declined, from 65.5% of the population in 2006 to 53.4% in Conversely, the proportion of people in GWS identifying with religions other than Christianity has increased, from 14.8% of the population in 2006 to 20.6% in The proportion of people in GWS identifying with no religion has also increased, from 10.6% of the population in 2006 to 17.9% in The proportion of people not stating a religion has fluctuated over this period, but has generally increased. As a whole, those identifying with Christianity in GWS has decreased by 2.9% in a ten-year period. Those identifying with religions other than Christianity in GWS has increased by 65.1% in a ten-year period. Finally, those identifying with no religion has increased by 100.7% in a ten-year period. Overall, religious affiliation in GWS has largely reflected regional and state trends. However, in the last ten years, Christianity in GWS has decreased at a lower rate, other religions in GWS have increased at a higher rate, and no religion in GWS has increased at a lower rate when compared to Greater Sydney, Rest of Sydney and NSW. Table 2: Changes over time in religious affiliation in GWS, Years year change ( ) 10 year change ( ) Religious affiliation % (number) % (number) % (number) Christianity Other religions No religion Not stated Total 65.5% 62.2% 53.4% -4.7% -2.9% 1,270,049 1,293,453 1,233,145-60,308-36, % 18.2% 20.6% 25.1% 65.2% 287, , ,134 94, , % 12.4% 17.9% 59.6% 100.7% 205, , , , , % 7.2% 8.1% 25.0% 6.8% 175, , ,981 37,541 11, % 100% 100% 10.9% 19.1% 1,937,990 2,080,757 2,307, , ,193 Please note that there are small random adjustments made to all cell values to protect the confidentiality of data. These adjustments may cause the sum of rows or columns to differ by small amounts from table totals. (Source: ABS 2017a, Table 12a,12b,12c) 4
5 Chart 2: Changes over time in religious affiliation in GWS, Other religions (Source: ABS 2017a, Table 12a,12b,12c) In the last ten years, the proportion of people in GWS reporting a religion other than Christianity in the Census has increased from 14.8% of the population in 2006 to 20.6% in Although increases occurred across most of the non-christian religions, the greatest proportional growth could be seen in Sikhism (an increase of 202% since 2006) and Hinduism (an increase of 148.2% since 2006) (See Table 3 and Chart 3). Overall, trends in identifying with non-christian religions in GWS have largely reflected regional and state figures. However, in the last ten years, Buddhism has increased at a lower rate and Hinduism, Islam, Sikhism and other religious groups have increased at a higher rate when compared to Greater Sydney, Rest of Sydney and NSW. Table 3: Changes over time in other religions in GWS, Years year change ( ) 10 year change ( ) Religious affiliation % (number) % (number) % (number) Buddhism Islam Hinduism Sikhism Other religious groups 5.0% 5.3% 4.8% 0.6% 14.2% 96, , , , % 8.0% 9.1% 26.6% 66.3% 126, , ,683 44,227 83, % 3.6% 4.9% 52.8% 148.2% 45,716 74, ,462 39,229 67, % 0.7% 1.0% 50.5% 202.2% 7,502 15,068 22,674 7,606 15, % 0.6% 0.7% 26.8% 65.6% 9,366 12,232 15,507 3,275 6,141 Please note that there are small random adjustments made to all cell values to protect the confidentiality of data. These adjustments may cause the sum of rows or columns to differ by small amounts from table totals. Please note Judaism was not included in this section as it only represents 0.1% of the GWS population. (Source: ABS 2017a, Table 12a,12b,12c) 5
6 Chart 3: Changes over time in other religions in GWS, Religious affiliation and age (Source: ABS 2017a, Table 12a,12b,12c) Table 4 shows the religious affiliation of age groups within GWS in All age groups were still more likely to identify with Christianity than other religions or no religion. When looking within religious affiliation categories however, young adults (18-34 years) were most likely to report not having a religion (22.0% of year population in GWS) and more likely to be affiliated with non-christian religions (24.9%) than any other age group. Older people, particularly those over 65 years old, were significantly more likely to report Christianity as their religion (71.5% of 65+ population in GWS) than their non-christian or non-religious counterparts. The religious affiliation of those under 18 is most similar to the year age group, suggesting the form may be completed with their parents beliefs. These findings are similar to regional and state trends. Age groups (years) Under Table 4: Religious affiliation and age in GWS, 2016 Christianity Other religions No religion Not stated or inadequately described Total % (number) 50.1% 23.5% 18.7% 7.7% 100% 287, , ,383 44, , % 24.9% 22.0% 8.8% 100% 254, , ,487 50, , % 22.4% 17.3% 7.9% 100% 250, ,902 82,531 37, , % 15.9% 16.5% 7.8% 100% 237,500 62,977 65,285 30, , % 9.4% 10.9% 8.2% 100% 203,846 26,689 31,182 23, ,102 Please note that there are small random adjustments made to all cell values to protect the confidentiality of data. These adjustments may cause the sum of rows or columns to differ by small amounts from table totals. (Source: ABS Census TableBuilder Pro 2017) 6
7 Religious affiliation and country of birth Table 5 shows the religious affiliation of Australian-born and elsewhere-born people within GWS in Those born in Australia are more likely to report an affiliation with Christianity (63.0% of the Australian-born population in GWS) than those born elsewhere (45.5% of the born-elsewhere population in GWS). The proportion of those born elsewhere who were affiliated with a non-christian religion (35.0%) was higher than those born in Australia (12.1%). Those identifying with no religion are more likely to be born in Australia (20.9%) than elsewhere (15.7%). These findings are similar to regional and state trends. However those born in Australia and elsewhere in GWS have a higher affiliation with non-christian religions than Greater Sydney, Rest of Sydney and NSW. This suggests that these religious communities are starting and establishing their families in GWS rather than other areas of Sydney. For more information on cultural and linguistic diversity in GWS, please see the 2016 Census CALD paper on WESTIR Limited s website. Table 5: Religious affiliation and country of birth in GWS, 2016 Country of birth Born in Australia (including external territories) Born elsewhere Christianity Other religions No religion % (number) Not stated or inadequately described Total 63.0% 12.1% 20.9% 3.9% 100% 807, , ,945 50,435 1,280, % 35.0% 15.7% 3.8% 100% 405, , ,203 33, ,768 Not stated 15.3% 4.9% 3.5% 76.3% 100% 20,642 6,667 4, , ,913 Please note that there are small random adjustments made to all cell values to protect the confidentiality of data. These adjustments may cause the sum of rows or columns to differ by small amounts from table totals. (Source: ABS Census TableBuilder Pro 2017) In Detail: Religious affiliation in Greater Western Sydney The next section provides a more detailed analysis of the major religious categories in GWS. Data used in this section is obtained from Tables 1 4 at the end of this topic paper. Table 1a c shows the religious affiliation of those living in GWS in 2016, broken down by LGA and relevant regional and state counterparts (GWS, Greater Sydney, Rest of Sydney, FACS WS district, FACS SWS district and NSW). Table 2a c shows the change in religious affiliation in GWS and relevant counterparts for five-year ( ) and ten-year ( ) periods. Table 3 shows an expanded version of religious affiliation and age in GWS in 2016 and Table 4 shows the expanded version of religious affiliation and country of birth in GWS in
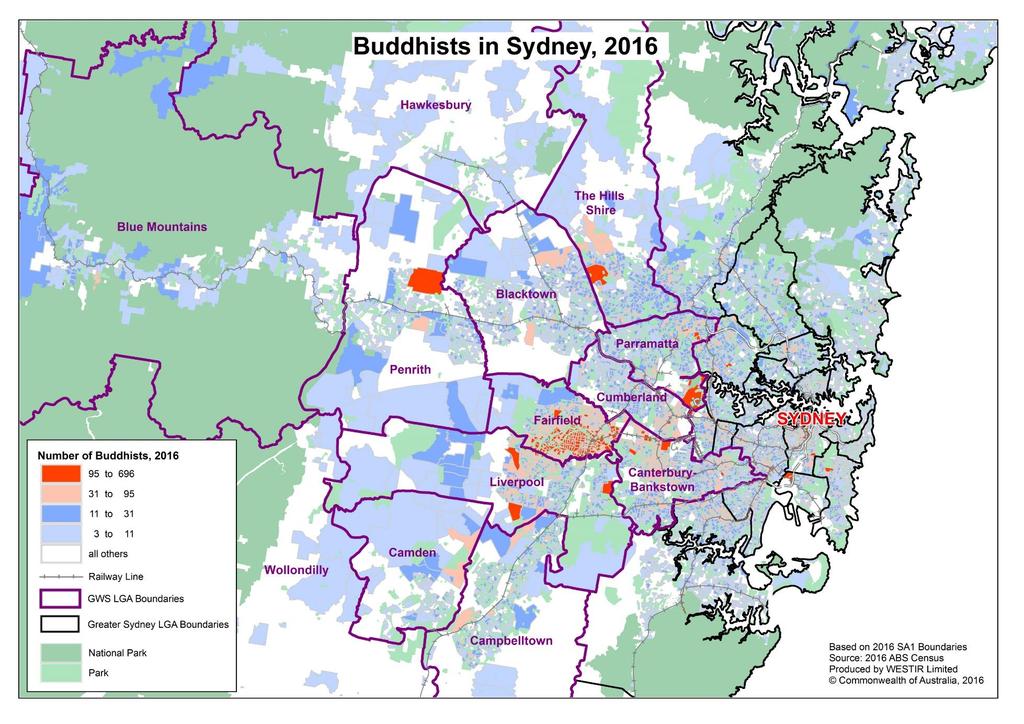
8 Buddhism Size: In 2016, there were 110,566 Buddhists in GWS, comprising 4.8% of the total population. There was a higher proportion of Buddhists in GWS compared to FACS WS district (2.5% of the total population), Greater Sydney (3.9%), Rest of Sydney (3.0%), and NSW (2.8%), but a lower proportion compared to FACS SWS district (7.3%). Distribution: The highest proportion of Buddhists were found in the LGAs of Fairfield (41,136; 20.7% of the LGA population), Canterbury Bankstown (21,215; 6.1%) and Liverpool (11,268; 5.5%) and the lowest proportion were found in Wollondilly LGA (244; 0.5%). The map on p. 9 shows the distribution of Buddhists in GWS in Notable concentrations of Buddhists can be found in the Fairfield suburbs of Canley Vale, Canley Heights, Cabramatta and Lansvale and south-east Parramatta suburbs of Homebush Bay, Silverwater and Concord West. Other concentrations of Buddhists are also found in suburbs located in Canterbury Bankstown, Liverpool, Penrith and The Hills Shire LGAs. Changes over time: The number of Buddhists in GWS has increased by 14.2% since 2006 and 0.6% since These five and ten-year increases are lower than those seen for comparative regional and state counterparts (except FACS SWS district). It is also lower than those identifying with non-christian religions (notably South Asian religions such as Hinduism and Sikhism) and no religion in GWS within the same period. Age: Buddhists in GWS are most likely to be in the year age group (6.6% of year population in GWS) than any other age group. There is a higher proportion of Buddhists in GWS in the older age groups (50+ years old) and a lower proportion in the younger age groups (under 35 years old). These findings are similar to regional and state trends for Buddhism. Country of birth: Buddhists in GWS are more likely to be born elsewhere (9.0% of the born-elsewhere population in GWS) than in Australia (2.2% of the Australian-born population in GWS). For those born elsewhere, most identified their country of birth within the region of South-East Asia or North-East Asia. These findings are similar to regional and state trends, however GWS has a higher proportion of Buddhists born in Australia than Greater Sydney, Rest of Sydney and NSW but a lower proportion of Buddhists born elsewhere when compared to Rest of Sydney and FACS SWS district. 8
9 9
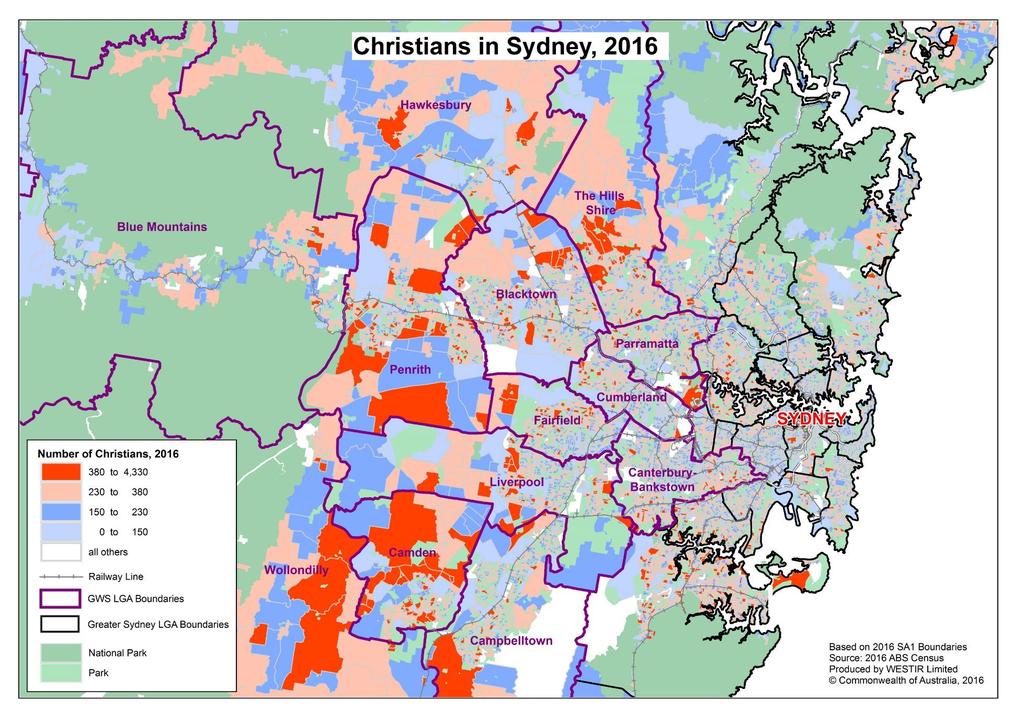
10 Christianity Size: In 2016, there were 1,233,145 Christians in GWS, comprising 53.4% of the total population. There was a higher proportion of Christians in GWS compared to Greater Sydney (51.7% of the total population) and Rest of Sydney (50.2%), comparative proportion to FACS WS and FACS SWS districts (53.6% and 53.9%) and lower proportion than NSW (55.2%). Distribution: The highest proportion of Christians were found in the LGAs of Wollondilly (33,941; 70.0% of the LGA population), Camden (54,231; 69.3%) and Hawkesbury (42,579; 61.5%) and the lowest proportions were found in the LGAs of Cumberland (86,135; 39.9%) and Parramatta (100,380; 44.4%). The map on p. 11 shows the distribution of Christians in GWS in Notable concentrations of Christians can be found throughout the region, particularly within the north to south corridor of the region. Denominations: The largest Christian denominations in GWS were Catholic (622,742; 27.0% of the total population) and Anglican (248,909; 10.8%). The highest proportion of Catholics were found in Camden LGA (26,876; 34.4% of the LGA population) and the lowest proportion in Blue Mountains LGA (15,171; 19.7%). The highest proportion of Anglicans were found in Wollondilly LGA (13,342; 27.5%) and the lowest proportion in Cumberland LGA (9,889; 4.6%). Changes over time: Christianity is still the most common religion in GWS, but those identifying with the religion have decreased by 2.9% since 2006 and 4.7% since These five and ten-year decreases are still lower than those seen for comparative regional and state counterparts (except FACS SWS district). Age: Christians in GWS are most likely to be in the 65+ age group (71.5% of the 65+ population in GWS) than any other age group. There is a higher proportion of Christians in GWS in the older age groups (50+ years old) and a lower proportion in the younger age groups (under 35 years old). These findings are similar to regional and state trends for Christianity. Country of birth: Christians in GWS are more likely to be born in Australia (63.0% of the Australian-born population in GWS) than elsewhere (45.5% of the born-elsewhere population in GWS). These findings are similar to regional and state trends, although there is still a higher proportion of Christians in GWS that were born elsewhere than in other areas of Sydney and NSW. 10
11 11
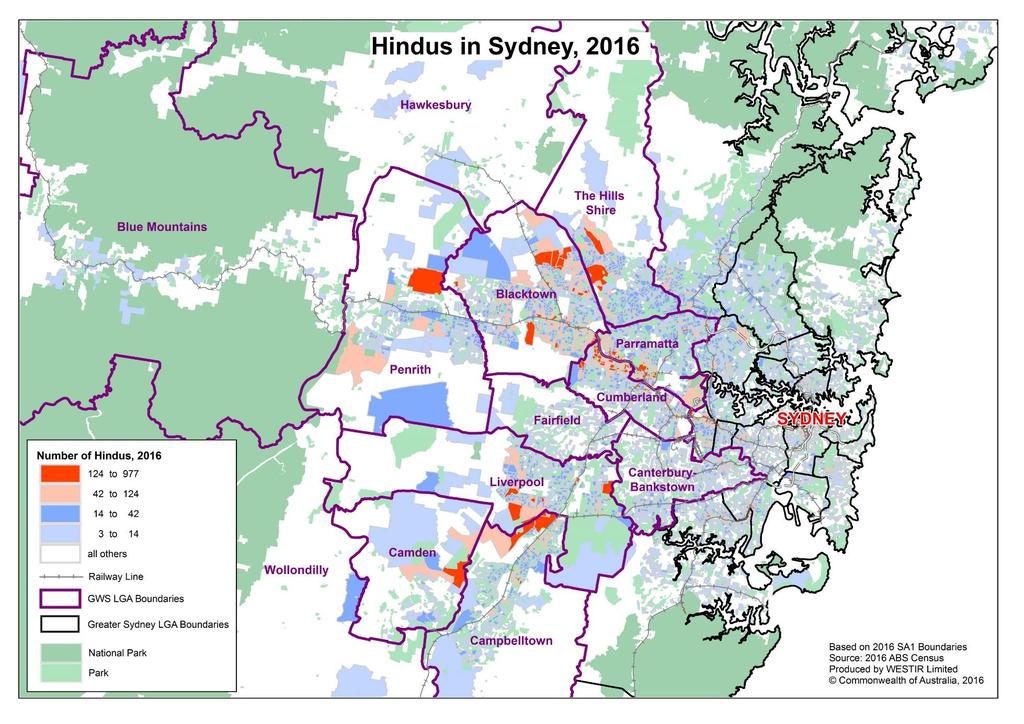
12 Hinduism Size: In 2016, there were 113,462 Hindus in GWS, comprising 4.9% of the total population. There was a higher proportion of Hindus in GWS compared to FACS SWS district (2.5% of the total population), Greater Sydney (3.5%), Rest of Sydney (2.3%) and NSW (2.4%), but a lower proportion compared to FACS WS district (6.7%). Distribution: The highest proportion of Hindus were found in the LGAs of Cumberland (22,025; 10.2% of the LGA population) and Blacktown (28,781; 8.5%) and the lowest proportion were found in the LGAs of Wollondilly (53; 0.1%) and Hawkesbury (103; 0.2%). The map on p. 13 shows the distribution of Hindus in GWS in Notable concentrations of Hindus can be found in the corridor of suburbs between Cumberland and Parramatta LGAs (notably Northmead, Parramatta and Rosehill), Blacktown LGA suburbs of Riverstone, Marsden Park, Glenwood, Doonside, Woodcroft, Blacktown East/Kings Park and Toongabbie, and Liverpool LGA suburbs of Hoxton Park, Macquarie Fields and Glenfield. Changes over time: The number of Hindus in GWS has increased by 148.2% since 2006 and 52.8% since These five and ten-year increases are slightly higher than those seen for comparative regional and state counterparts (except FACS SWS district). Similar increases over time have also been observed with those identifying with other South Asian religions such as Sikhism. Age: Hindus in GWS are most likely to be in the year age group (9.4% of the year population in GWS) than any other age group. There is a higher proportion of Hindus in GWS in the younger age groups (under 35 years old) and a lower proportion in the older age groups (50+ years old). These findings are similar to regional and state trends for Hinduism, although there is still a higher proportion of Hindus in younger age groups in GWS than in other areas of Sydney and NSW. Country of birth: Hindus in GWS are more likely to be born elsewhere (10.0% of the born-elsewhere population in GWS) than in Australia (1.8% of the Australian-born population in GWS). For those born elsewhere, most identified their country of birth within the region of Southern and Central Asia. These findings are similar to regional and state trends, although there is still a higher proportion of Hindus in GWS that were born in both Australia and elsewhere than in other areas of Sydney and NSW. 12
13 13
14 Islam Size: In 2016, there were 210,683 Muslims in GWS, comprising 9.1% of the total population. There was a higher proportion of Muslims in GWS compared to FACS WS district (6.8% of the total population), Greater Sydney (5.3%), Rest of Sydney (1.7%) and NSW (3.6%), but a lower proportion compared to FACS SWS district (11.3%). Distribution: The highest proportion of Muslims were found in the LGAs of Cumberland (47,286; 21.9% of the LGA population) and Canterbury Bankstown (71,894; 20.8%) and the lowest proportion were found in Blue Mountains LGA (187; 0.2%). The map on p. 15 shows the distribution of Muslims in GWS in Notable concentrations of Muslims can be found in the Canterbury Bankstown suburbs of Greenacre, Lakemba, Punchbowl, Birrong, Georges Hall and Condell Park and Cumberland suburbs of Granville and Auburn, and parts of Blacktown and Liverpool LGAs. Changes over time: The number of Muslims in GWS has increased by 66.3% since 2006 and 26.6% since These five and ten-year increases are higher than those see for comparative regional and state counterparts (except FACS SWS district). However, it should be noted that Islam is roughly half the rate of growth seen by other non-christian religions (notably Hinduism and Sikhism) or secularism/no religion in GWS during this period. Age: Muslims in GWS are most likely to be under 18 (13.2% of the under 18 population of GWS) than any other age group. There is a higher proportion of Muslims in GWS in the younger age groups (under 35 years old) and a lower proportion in the older age groups (50+ years old). These findings are similar to regional and state trends for Islam, although there is still a higher proportion of Muslims in younger age groups in GWS than in other areas of Sydney and NSW. Country of birth: Muslims in GWS are more likely to be born elsewhere (12.9% of the born-elsewhere population in GWS) than in Australia (7.2% of the Australian-born population in GWS). For those born elsewhere, most identified their country of birth within the regions of Southern and Central Asia or North Africa and the Middle East. These findings are similar to regional and state trends, although there is still a higher proportion of Muslims in GWS that were born in both Australia and elsewhere than in other areas of Sydney and NSW. 14
15 15
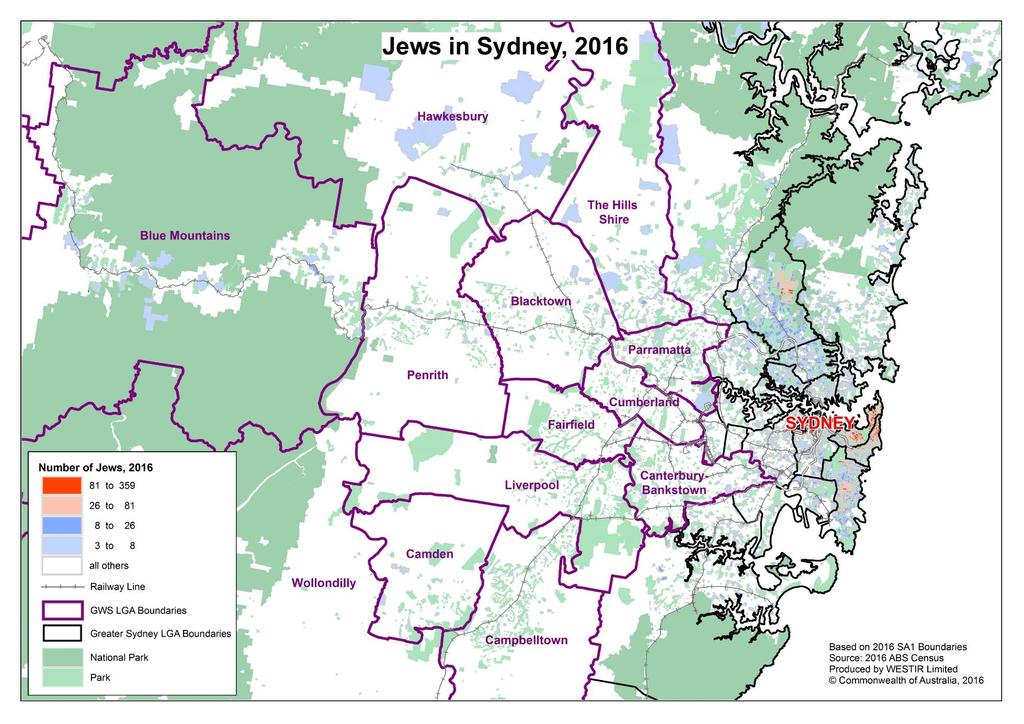
16 Judaism Size: In 2016, there were 1,242 Jews in GWS, comprising 0.1% of the total population. This is comparative to FACS WS and SWS districts (0.1% and 0.0% of the total population) but lower than Greater Sydney (0.7%), Rest of Sydney (1.3%) and NSW (0.5%). Distribution: The highest number of Jews were found in The Hills Shire (195; 0.1% of the LGA population) and the lowest number were found in Fairfield (21; 0.0%). The map on p. 17 shows the distribution of Jews in GWS in The map shows that there is little to no concentration of Jews in GWS. Notable concentrations of Jews are located outside the region, particularly the Eastern suburbs and North Shore. Changes over time: The proportion of Jews in GWS has fluctuated, increasing by 12.5% since 2006 and decreasing by 4.2% since This is comparative to regional and state trends. Age: Jews in GWS are most likely to be over 35 years old (0.1% of the over 35 years old population in GWS) than any other age group. Due to their small numbers in GWS, it is difficult to compare with regional and state trends. Country of birth: There was the same proportion of Jews in GWS born in Australia (0.1% of the Australian-born population in GWS) and elsewhere (0.1% of the elsewhere-born population in GWS). Due to their small numbers in GWS, it is difficult to compare with regional and state trends. 16
17 17
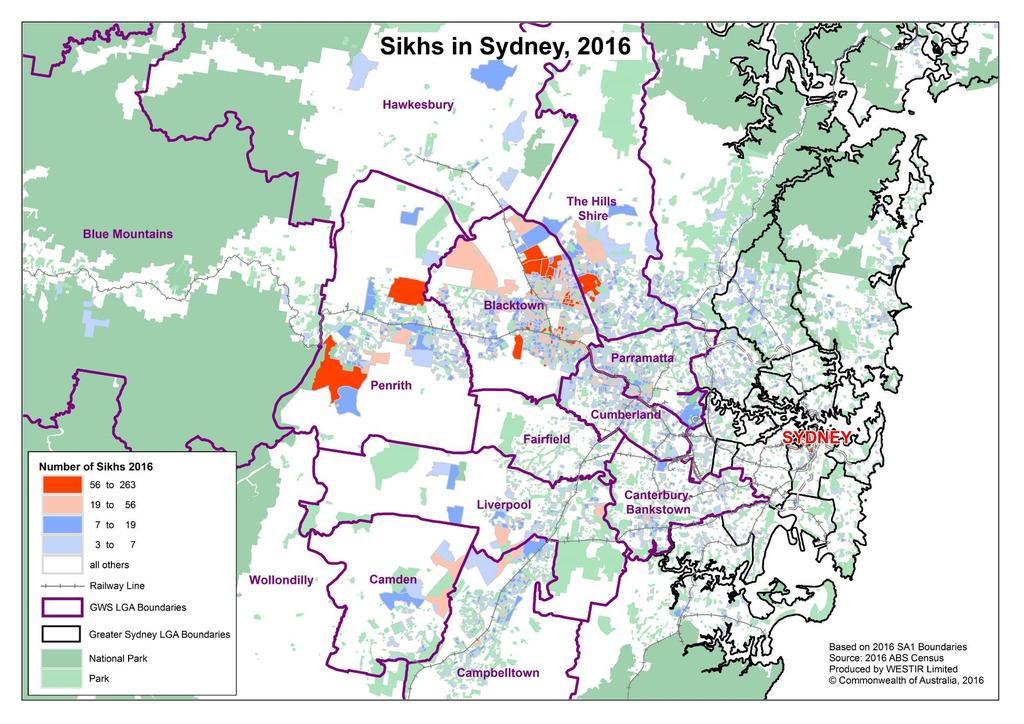
18 Sikhism Size: In 2016, there were 22,674 Sikhs in GWS, comprising 1.0% of the total population. There were a higher proportion of Sikhs in GWS compared to FACS SWS district (0.3% of the total population), Greater Sydney (0.6%), Rest of Sydney (0.2%) and NSW (0.4%), but a lower proportion than FACS WS district (1.5%). Distribution: The highest proportion of Sikhs were found in the LGAs of Blacktown (11,380; 3.4% of the LGA population) and Parramatta (2,667; 1.2%) and the lowest proportion were found in Wollondilly (14; 0.0%). The map on p. 19 shows the distribution of Sikhs in GWS in Notable concentrations of Sikhs can be found in the Blacktown suburbs of Riverstone, Marsden Park, Parklea, Kellyville Ridge, Glenwood, Blacktown East/Kings Park, Doonside and Woodcroft, the Parramatta suburb of Northmead and the Penrith suburbs of Castlereagh/Cranebrook and Glenmore Park. Changes over time: The number of Sikhs in GWS has increased by 202.2% since 2006 and 50.5% since These five and ten-year increases are higher than those seen for comparative regional and state counterparts (except FACS WS district). Similar increases over time have also been observed with those identifying with other South Asian religions such as Hinduism. Age: Sikhs in GWS are most likely to be in the year age group (1.7% of the year old population in GWS) than any other age group. There is a higher proportion of Hindus in GWS in the younger age groups (under 35 years old) and a lower proportion in the older age groups (50+ years old). These findings are similar to regional and state trends for Sikhs, although there is still a higher proportion of Sikhs in younger age groups in GWS than in other areas of Sydney and NSW. Country of birth: Sikhs in GWS are more likely to be born elsewhere (2.0% of the elsewhere-born population in GWS) than in Australia (0.4% of the Australian-born population in GWS). For those born elsewhere, most identified their country of birth within the region of Southern and Central Asia. These findings are similar to regional and state trends, although there is still a higher proportion of Hindus in GWS that were born in both Australia and elsewhere than in other areas of Sydney and NSW. 18
19 19
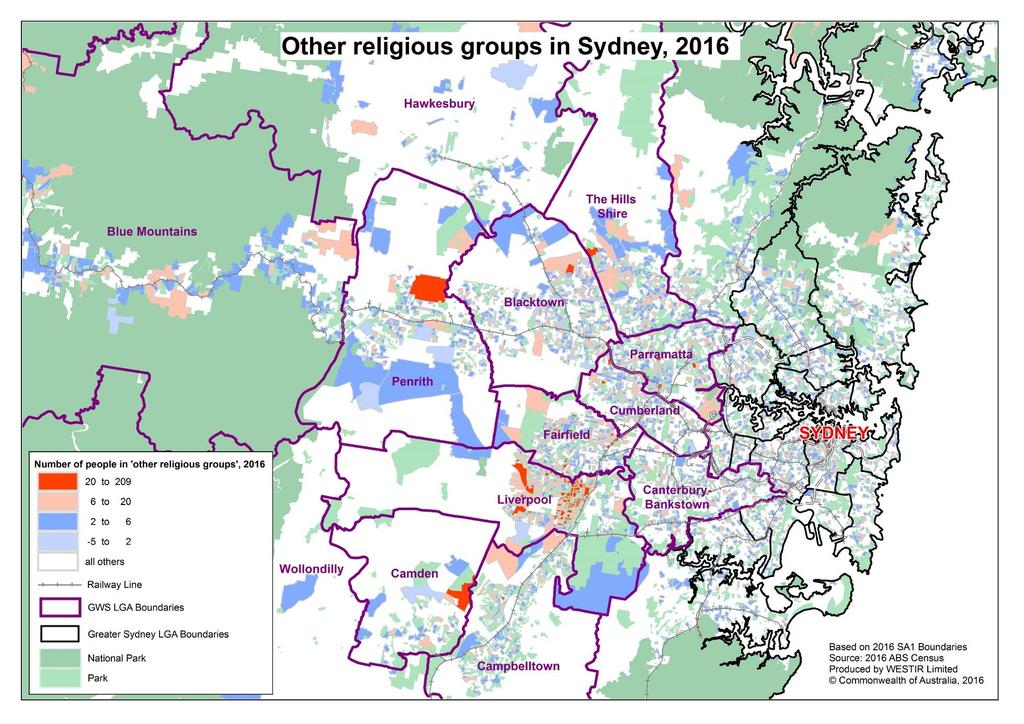
20 Other religious groups Size: In 2016, there were 15,507 people in GWS who identified with other religious groups, comprising 0.7% of the total population. This included Australian Aboriginal Traditional Religions and other religions such as 'Baha'i', 'Chinese Religions', 'Druse', 'Japanese Religions', 'Nature Religions', 'Spiritualism' and 'Miscellaneous Religions'. There was a higher proportion of people in GWS identifying with other religious groups than FACS WS district (0.5% of the total population), Greater Sydney (0.5%), Rest of Sydney (0.3%) and NSW (0.4%), but a lower proportion than the FACS SWS district (0.9%). Distribution: The highest proportion of people who identified with other religious groups were found in the LGAs of Liverpool (5.457; 2.7% of the LGA population) and the lowest proportion in Wollondilly (86; 0.2%). The map on p. 21 shows the distribution of people identifying with other religious groups in GWS in Small concentrations of other religious groups can be found in the LGAs of Camden, Cumberland, Fairfield, Parramatta, Penrith and The Hills Shire, with a notable concentration in central and eastern suburbs of Liverpool LGA such as Casula. Changes over time: The number of people who identified with other religious groups in GWS has increased by 65.6% since 2006 and 26.8% since These five and ten-year increases are higher than those see for comparative regional and state counterparts (except FACS SWS district). Age: People in GWS identifying with other religious groups are most likely to be in the year age group (0.8% of the years old population in GWS) than any other age group. Due to their small numbers in GWS, it is difficult to compare but they appear to be slightly younger than their counterparts on a regional and state level. Country of birth: People in GWS identifying with other religious groups are more likely to be born elsewhere (1.1% of the elsewhere-born population in GWS) than in Australia (0.4% of the Australian-born population in GWS). Due to their small numbers in GWS, it is difficult to compare with regional and state trends. 20
21 21
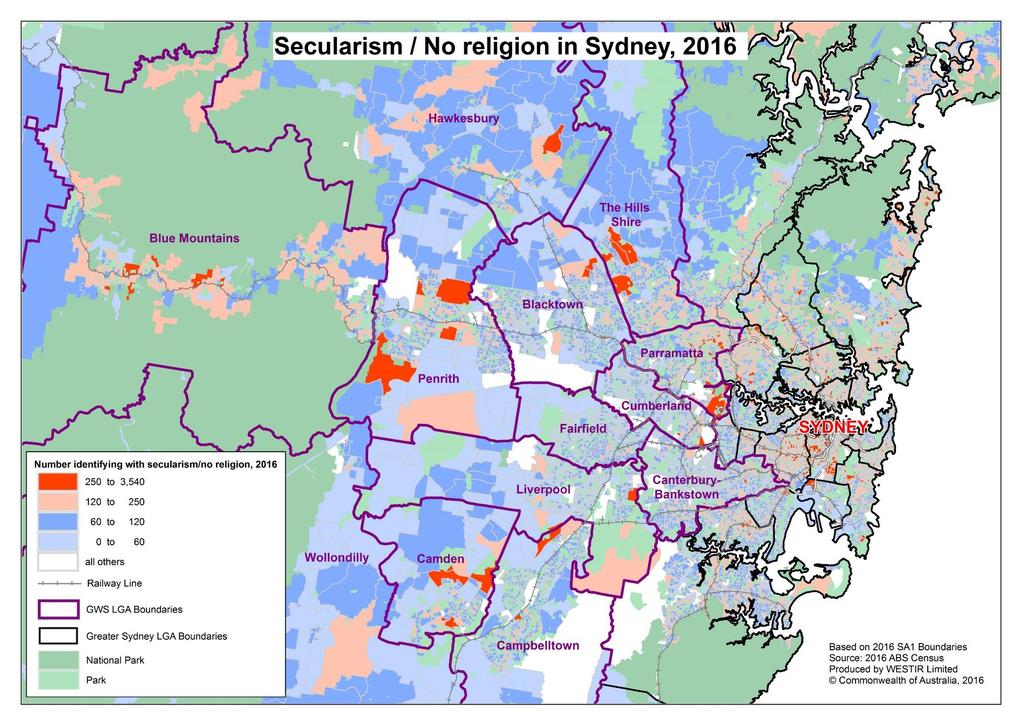
22 Secularism and no religion Size: In 2016, there were 412,886 people in GWS who identified with secular beliefs and other spiritual beliefs and no religious affiliation. This comprised of 17.9% of the total population. There was a lower proportion of people identifying with secularism/no religion in GWS than FACS WS district (20.3% of the total population), Greater Sydney (25.0%), Rest of Sydney (31.6%) and NSW (25.5%), but a higher proportion than FACS SWS district (15.6%). Distribution: The highest proportion of people identifying with secularism/no religion were found in the LGAs of Blue Mountains (28,221; 36.7% of the LGA population) and Parramatta (56,142; 24.8%) and the lowest proportion were found in Liverpool (23,448; 11.5%). The map on p. 23 shows the distribution of people identifying with secularism/no religion in GWS in Notable concentrations of people identifying with secularism/no religion can be found in the upper Blue Mountains suburbs between Linden and Katoomba, the north-west suburbs of Pitt Town, McGraths Hill, Kellyville, Rouse Hill, Beaumont Hills, Parklea and Kellyville Ridge, Penrith suburbs of Kingswood, Werrington and Glenmore Park, south eastern Parramatta suburbs of Homebush Bay, Silverwater and Concord West, and Camden suburbs of Claymore and Leppington. Changes over time: The number of people identifying with secularism/no religion in GWS has increased by 100.7% since 2006 and 59.6% since These five and ten-year increases are comparable to regional and state counterparts (except FACS SWS district which has seen a lower increase). Age: People identifying with secularism/no religion in GWS are most likely to be in the year age group (24.9% of the year old population in GWS) than any other age group. There is a higher proportion of people identifying with secularism/no religion in GWS in the younger age groups (under 35 years old) and a lower proportion in the older age groups (50+ years old). These findings are similar to regional and state trends for secularism/no religion, although there is still a lower proportion of people identifying with secularism/no religion across all age groups in GWS than in other areas of Sydney and NSW. Country of birth: People identifying with secularism/no religion in GWS are more likely to be born in Australia (20.9% of the Australian-born population in GWS) than elsewhere (15.7% of the elsewhere-born population in GWS). These findings are similar to regional and state trends, although there is a lower proportion of people identifying with secularism/no religion in GWS that were born both in Australia and elsewhere than in other areas of Sydney and NSW. 22
23 23
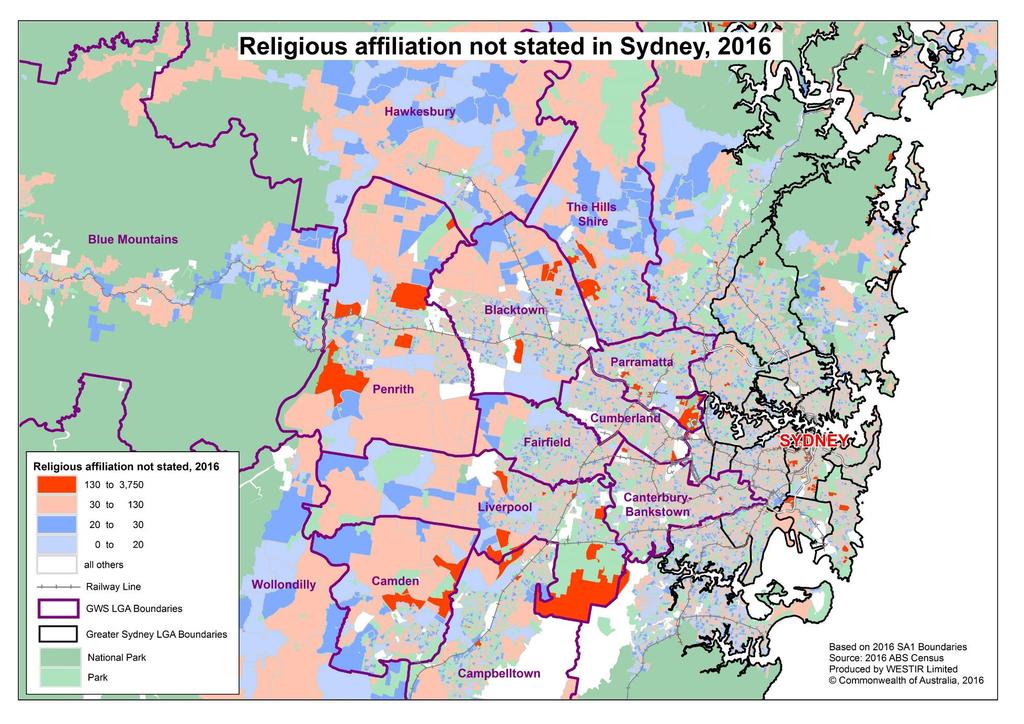
24 Religious affiliation not stated Size: In 2016, there were 186,981 people in GWS who did not state any religious affiliation on the Census form. This comprised of 8.1% of the total population. There were a lower proportion of people who did not state any religious affiliation in GWS compared to Greater Sydney (8.8% of the total population), Rest of Sydney (9.5%) and NSW (9.2%), and a comparative proportion in FACS WS (8.1%) and FACS SWS (8.2%) districts. Distribution: The highest proportion of people who did not state any religious affiliation were found in the LGAs of Parramatta (21,219; 9.4% of the LGA population) and Liverpool (18,828; 9.2%) and the lowest proportion were found in The Hills Shire (9,288; 5.9%). The map on p. 25 shows the distribution of people who did not state any religious affiliation in GWS in Notable concentrations can be found in the north-west suburbs of Blacktown and The Hills Shire LGAs, south eastern suburbs of Parramatta and Liverpool LGAs, and central suburbs of Penrith and Camden LGAs. These are similar patterns found in the map for people identifying with secularism/no religion on p. 23. Changes over time: The number of people who did not state any religious affiliation in GWS has increased by 6.8% since 2006 and 25.1% since Comparisons with regional and state counterparts are difficult as they have fluctuated over a five and ten-year period. Age: The proportion of people not stating a religious affiliation is consistent, with all age groups no more or less likely to not state a religion. This is similar to regional and state trends. Country of birth: People not stating a religious affiliation were no more or less likely to be born in Australia (3.9% of the Australian-born population in GWS) than elsewhere (3.8% of the elsewhere-born population in GWS). This is similar to regional and state trends. 24
25 25
26 Conclusions In conclusion, Greater Western Sydney (GWS) is a religiously diverse community, with the 2016 Census data showing higher rates of religious affiliation and lower rates of secularism/no religion than regional, state or even national figures. At 53.4% of the total GWS population, Christianity was still the most common religion of the region in Overall, affiliation with Christianity in GWS declined over a five to ten-year period, although these decreases were still lower than those seen for comparative regional and state counterparts. Those identifying with Christianity in GWS are more likely to be in older age groups (65+) and be born in Australia than in other areas of the world. The number and proportion of people in GWS identifying with other non-christian religions continues to increase at rates higher than regional and state counterparts. In particular, South Asian religions such as Hinduism and Sikhism have significantly increased in GWS over the last five to ten years, at a greater rate than other non-christian religions such as Islam or secularism/no religion. Those identifying with non-christian religions in GWS are more likely to be in the younger age groups (under 35 years old) and be born elsewhere than in Australia. While people in GWS continue to strongly identify with various religious groups, an increasing number of people in the region chose to identify with secularism/no religion or to not state any religious affiliation in the last five to ten years. But this was still lower than regional and state counterparts. Those identifying with secularism/no religion in GWS are more likely to be in the year age group and be born in Australia than in other areas of the world. References Australian Bureau of Statistics (ABS) 2017a, 2016 Census Time Series Profile: Australia, accessed 24 July 2017, ABS 2017b, Religion in Australia 2016 Census Data Summary, accessed 1 August 2017, Barker, R. 2017, Religion and the Census: Australia s Unique Relationship with Faith and Unbelief, ABC Religion and Ethics Opinion, accessed 24 July 2017 at McCrindle, M. et al 2017, Faith and Belief in Australia: a national study on religion, spirituality and worldview trends, McCrindle Research Pty Ltd, Baulkham Hills. Accessed 24 July 2017 at 26
27 Table 1a: Religious Affiliation of Person in GWS (including Lithgow and Wingecarribee LGAs), 2016 Blacktown % Blue Mountains % Camden % Campbelltown % Canterbury- Bankstown % Cumberland % Fairfield % Buddhism 5, % 1, % % 4, % 21, % 9, % 41, % Christianity: Anglican 35, % 13, % 16, % 23, % 19, % 9, % 7, % Assyrian Apostolic % 6 0.0% % % % % 7, % Baptist 4, % 2, % % 2, % 3, % 2, % 2, % Brethren % % % % % % 7 0.0% Catholic 98, % 15, % 26, % 41, % 81, % 51, % 61, % Churches of Christ % % % % % % % Eastern Orthodox 6, % % 1, % 2, % 30, % 5, % 7, % Jehovah's Witnesses 1, % % % % % % % Latter-day Saints 2, % % % 1, % % % % Lutheran % % % % % % % Oriental Orthodox 3, % % % % 2, % % 1, % Other Protestant 3, % % % 1, % 1, % % % Pentecostal 7, % % 1, % 2, % 2, % 2, % 1, % Presbyterian and Reformed 5, % 2, % 1, % 3, % 4, % 3, % 1, % Salvation Army % % % % % % % Seventh-day Adventist 1, % % % % % % % Uniting Church 6, % 2, % 1, % 2, % 4, % 2, % 1, % Christian, nfd(a) 10, % 2, % 1, % 4, % 7, % 4, % 7, % Other Christian % % % % % % % Total Christianity 189, % 40, % 54, % 89, % 161, % 86, % 102, % Hinduism 28, % % % 7, % 6, % 22, % 1, % Islam 22, % % 1, % 12, % 71, % 47, % 11, % Judaism % % % % % % % Sikhism 11, % % % 1, % 1, % 2, % % Other religious groups(b) 1, % % % % 1, % 1, % 1, % Secular Beliefs and Other Spiritual Beliefs and No Religious Affiliation(c) 51, % 28, % 15, % 28, % 52, % 30, % 25, % Religious affiliation not stated(d) 25, % 6, % 5, % 13, % 29, % 17, % 14, % Total 336, % 76, % 78, % 157, % 346, % 216, % 198, % This table is based on place of usual residence. (a) In 2006 and 2011 comprises 'Christian, nfd', 'Apostolic Church, so described', 'Church of God, so described, Australian Christian Churches, so described', ' 'New Church Alliance, so described' and 'Faith Churches'. (b) Comprises Australian Aboriginal Traditional Religions, 'Baha'i', 'Chinese Religions', 'Druse', 'Japanese Religions', 'Nature Religions', 'Spiritualism' and 'Miscellaneous Religions'. (c) In 2006 and 2011 comprises 'No Religion, nfd', 'Agnosticism', 'Atheism', 'Humanism', 'Rationalism', 'New Age, so described', 'Theism', 'Pantheism', 'Unitarian and 'Religious Belief nfd'. In 2016 the order of the response categories changed on the Census form, no religion moved to the first response. This may result in higher responses reported for the 'No Religion, so described' category. (d) In 2006 and 2011 includes 'Not defined'. In 2016 includes 'Inadequately described'. Please note that there are small random adjustments made to all cell values to protect the confidentiality of data. These adjustments may cause the sum of rows or columns to differ by small amounts from table totals. (Source: ABS 2016 Census Time Series Profile, Table 12c) 27
28 Table 1b: Religious Affiliation of Person in GWS (including Lithgow and Wingecarribee LGAs), 2016 Hawkesbury % Lithgow % Liverpool % Parramatta % Penrith % The Hills Shire % Wingecarribee % Wollondilly % Buddhism % % 11, % 8, % 2, % 4, % % % Christianity: Anglican 15, % 4, % 15, % 18, % 36, % 23, % 12, % 13, % Assyrian Apostolic 7 0.0% 0 0.0% 1, % % % % 0 0.0% 3 0.0% Baptist 1, % % 2, % 4, % 1, % 2, % % % Brethren % % % % % % % % Catholic 17, % 5, % 58, % 47, % 62, % 45, % 10, % 14, % Churches of Christ % 6 0.0% % % % % % % Eastern Orthodox % % 11, % 3, % 3, % 2, % % % Jehovah's Witnesses % % % % % % % % Latter-day Saints % % % % % % % % Lutheran % % % % % % % % Oriental Orthodox % 8 0.0% 2, % 1, % % % % % Other Protestant % % % 1, % % % % % Pentecostal % % 3, % 2, % 2, % 4, % % % Presbyterian and Reformed 1, % % 2, % 7, % 4, % 4, % 1, % % Salvation Army % % % % % % % % Seventh-day Adventist % % % % % % % % Uniting Church 2, % 1, % 1, % 5, % 3, % 4, % 1, % 1, % Christian, nfd(a) 1, % % 6, % 5, % 4, % 3, % 1, % 1, % Other Christian % % % % % % % % Total Christianity 42, % 12, % 109, % 100, % 125, % 95, % 29, % 33, % Hinduism % % 10, % 25, % 3, % 7, % % % Islam % % 24, % 9, % 4, % 4, % % % Judaism % % % % % % % % Sikhism % % % 2, % 1, % 1, % % % Other religious groups(b) % % 5, % 1, % % % % % Secular Beliefs and Other Spiritual Beliefs and No Religious Affiliation(c) 15, % 4, % 23, % 56, % 42, % 33, % 12, % 10, % Religious affiliation not stated(d) 5, % 2, % 18, % 21, % 16, % 9, % 4, % 3, % Total 64, % 21, % 204, % 226, % 196, % 157, % 47, % 48, % This table is based on place of usual residence. (a) In 2006 and 2011 comprises 'Christian, nfd', 'Apostolic Church, so described', 'Church of God, so described, Australian Christian Churches, so described', ' 'New Church Alliance, so described' and 'Faith Churches'. (b) Comprises Australian Aboriginal Traditional Religions, 'Baha'i', 'Chinese Religions', 'Druse', 'Japanese Religions', 'Nature Religions', 'Spiritualism' and 'Miscellaneous Religions'. (c) In 2006 and 2011 comprises 'No Religion, nfd', 'Agnosticism', 'Atheism', 'Humanism', 'Rationalism', 'New Age, so described', 'Theism', 'Pantheism', 'Unitarian and 'Religious Belief nfd'. In 2016 the order of the response categories changed on the Census form, no religion moved to the first response. This may result in higher responses reported for the 'No Religion, so described' category. (d) In 2006 and 2011 includes 'Not defined'. In 2016 includes 'Inadequately described'. Please note that there are small random adjustments made to all cell values to protect the confidentiality of data. These adjustments may cause the sum of rows or columns to differ by small amounts from table totals. (Source: ABS 2016 Census Time Series Profile, Table 12c) 28
29 Table 1c: Religious Affiliation of Person in GWS (including Lithgow and Wingecarribee LGAs), 2016 GWS % Greater Sydney % Rest of Sydney % FACS WS % FACS SWS % NSW % Buddhism 110, % 186, % 75, % 31, % 79, % 207, % Christianity: Anglican 248, % 580, % 331, % 157, % 108, % 1,161, % Assyrian Apostolic 10, % 10, % % % 9, % 10, % Baptist 31, % 59, % 28, % 19, % 13, % 94, % Brethren 2, % 3, % % 2, % % 6, % Catholic 622, % 1,213, % 590, % 343, % 294, % 1,846, % Churches of Christ 2, % 4, % 1, % 2, % % 6, % Eastern Orthodox 78, % 165, % 87, % 22, % 55, % 188, % Jehovah's Witnesses 7, % 11, % 4, % 3, % 3, % 22, % Latter-day Saints 9, % 12, % 2, % 5, % 4, % 16, % Lutheran 3, % 9, % 5, % 2, % 1, % 20, % Oriental Orthodox 14, % 25, % 10, % 7, % 7, % 26, % Other Protestant 12, % 23, % 11, % 7, % 4, % 32, % Pentecostal 32, % 52, % 20, % 20, % 11, % 77, % Presbyterian and Reformed 42, % 95, % 53, % 29, % 14, % 188, % Salvation Army 3, % 5, % 2, % 1, % 1, % 15, % Seventh-day Adventist 6, % 11, % 4, % 4, % 2, % 22, % Uniting Church 41, % 97, % 55, % 28, % 15, % 217, % Christian, nfd(a) 60, % 108, % 47, % 32, % 29, % 165, % Other Christian 2, % 4, % 1, % 1, % 1, % 7, % Total Christianity 1,233, % 2,496, % 1,262, % 693, % 582, % 4,127, % Hinduism 113, % 170, % 56, % 87, % 26, % 181, % Islam 210, % 253, % 42, % 88, % 122, % 267, % Judaism 1, % 35, % 33, % % % 36, % Sikhism 22, % 26, % 4, % 19, % 3, % 31, % Other religious groups(b) 15, % 23, % 8, % 6, % 9, % 31, % Secular Beliefs and Other Spiritual Beliefs and No Religious Affiliation(c) 412, % 1,206, % 794, % 262, % 168, % 1,910, % Religious affiliation not stated(d) 186, % 425, % 238, % 105, % 89, % 684, % Total 2,307, % 4,823, % 2,516, % 1,295, % 1,081, % 7,480, % This table is based on place of usual residence. (a) In 2006 and 2011 comprises 'Christian, nfd', 'Apostolic Church, so described', 'Church of God, so described, Australian Christian Churches, so described', ' 'New Church Alliance, so described' and 'Faith Churches'. (b) Comprises Australian Aboriginal Traditional Religions, 'Baha'i', 'Chinese Religions', 'Druse', 'Japanese Religions', 'Nature Religions', 'Spiritualism' and 'Miscellaneous Religions'. (c) In 2006 and 2011 comprises 'No Religion, nfd', 'Agnosticism', 'Atheism', 'Humanism', 'Rationalism', 'New Age, so described', 'Theism', 'Pantheism', 'Unitarian and 'Religious Belief nfd'. In 2016 the order of the response categories changed on the Census form, no religion moved to the first response. This may result in higher responses reported for the 'No Religion, so described' category. (d) In 2006 and 2011 includes 'Not defined'. In 2016 includes 'Inadequately described'. Please note that there are small random adjustments made to all cell values to protect the confidentiality of data. These adjustments may cause the sum of rows or columns to differ by small amounts from table totals. (Source: ABS 2016 Census Time Series Profile, Table 12c) 29
NCLS Occasional Paper Church Attendance Estimates
 NCLS Occasional Paper 3 2001 Church Attendance Estimates John Bellamy and Keith Castle February 2004 2001 Church Attendance Estimates John Bellamy and Keith Castle February 2004 Introduction The National
Studies of Religion. Changing patterns of religious adherence in Australia
 Studies of Religion Changing patterns of religious adherence in Australia After the Second World War thousands of migrants gained assisted passage each year and most settled in urban areas of NSW and Victoria.
A Review of the Environmental Context of the Uniting Church Synod of Victoria and Tasmania and some Implications for the Development of Ministry
 A Review of the Environmental Context of the Uniting Church Synod of Victoria and Tasmania and some Implications for the Development of Ministry Rev Dr Philip Hughes June 2014 1 Table of Contents Executive
Faith-sharing activities by Australian churches
 NCLS Occasional Paper 13 Faith-sharing activities by Australian churches Sam Sterland, Ruth Powell, Michael Pippett with the NCLS Research team December 2009 Faith-sharing activities by Australian churches
NCLS Occasional Paper 8. Inflow and Outflow Between Denominations: 1991 to 2001
 NCLS Occasional Paper 8 Inflow and Outflow Between Denominations: 1991 to 2001 Sam Sterland, Ruth Powell and Keith Castle March 2006 The National Church Life Survey The National Church Life Survey has
Studies of Religion I
 2016 HIGHER SCHOOL CERTIFICATE EXAMINATION Studies of Religion I Total marks 50 Section I Pages 2 5 General Instructions Reading time 5 minutes Working time 1 1 hours 2 Write using black pen Write your
Non-Religious Demographics and the Canadian Census Speech delivered at the Centre For Inquiry Ontario April 29, 2011
 Non-Religious Demographics and the Canadian Census Speech delivered at the Centre For Inquiry Ontario April 29, 2011 Contact: Greg Oliver President Canadian Secular Alliance president@secularalliance.ca
Introduction Defining the Challenge Snap Shot of Church Culture Intersecting Strategies How to Enter (Relationship) How to Stay (Respect) How to
 How to Stay (Respect) How to") 1 Introduction Defining the Challenge Snap Shot of Church Culture Intersecting Strategies How to Enter (Relationship) How to Stay (Respect) How to Depart (Revelation) Survey by: Pew Forum s On Religion
1 Introduction Defining the Challenge Snap Shot of Church Culture Intersecting Strategies How to Enter (Relationship) How to Stay (Respect) How to Depart (Revelation) Survey by: Pew Forum s On Religion
The Australian Church is Being Transformed: 20 years of research reveals changing trends in Australian church life
 The Australian Church is Being Transformed: 20 years of research reveals changing trends in Australian church life Dr Ruth Powell Director, NCLS Research Australia May 2015, Malaysia Powell, R. (2015).
HIGHER SCHOOL CERTIFICATE EXAMINATION STUDIES OF RELIGION. 2 UNIT (100 Marks) Time allowed Three hours (Plus 5 minutes reading time)
 Time allowed Three hours (Plus 5 minutes reading time)") N E W S O U T H W A L E S HIGHER SCHOOL CERTIFICATE EXAMINATION 1 STUDIES OF RELIGION 2 UNIT (100 Marks) Time allowed Three hours (Plus 5 minutes reading time) DIRECTIONS TO CANDIDATES Attempt FIVE questions.
N E W S O U T H W A L E S HIGHER SCHOOL CERTIFICATE EXAMINATION 1 STUDIES OF RELIGION 2 UNIT (100 Marks) Time allowed Three hours (Plus 5 minutes reading time) DIRECTIONS TO CANDIDATES Attempt FIVE questions.
The Zeal of the Convert: Religious Characteristics of Americans who Switch Religions
 The Zeal of the Convert: Religious Characteristics of Americans who Switch Religions By Allison Pond, Gregory Smith, Neha Sahgal and Scott F. Clement Pew Forum on Religion & Public Life Abstract: Religion
Summary of results Religion and Belief Survey
 Summary of results Religion and Belief Survey 2010-2011 1. Introduction 2 2. Methodology 2 3. Response Rates 2 4. Religious belief and affiliation 3 5. Requirements for specific religions and beliefs 7
A Handbook Of Churches and Councils Profiles of Ecumenical Relationships
 A Handbook Of Churches and Councils Profiles of Ecumenical Relationships Compiled by Huibert van Beek World Council of Churches Cover design: Rob Lucas 2006 World Council of Churches 150 route de Ferney,
Studies of Religion II
 2016 HIGHER SCHOOL CERTIFICATE EXAMINATION Studies of Religion II Total marks 100 Section I Pages 2 11 30 marks This section has two parts, Part A and Part B Allow about 50 minutes for this section Part
Studies of Religion II
 2013 H I G H E R S C H O O L C E R T I F I C A T E E X A M I N A T I O N Studies of Religion II Total marks 100 Section I Pages 2 11 30 marks This section has two parts, Part A and Part B Allow about 50
Trends in International Religious Demography. Todd M. Johnson Gina A. Zurlo
 Trends in International Religious Demography Todd M. Johnson Gina A. Zurlo World Christian Encyclopedia 1 st edition World Christian Database World Religion Database www.worldchristiandatabase.org
Key Issue 1: Where Are the World s Religions Distributed? Pages
 Key Issue 1: Where Are the World s Religions Distributed? Pages 184-195 1. Complete the following chart with notes: 4 Largest Religions Folk Religions Other Religions Unaffiliated % of world: % of world:
Occasional Paper 7. Survey of Church Attenders Aged Years: 2001 National Church Life Survey
 Occasional Paper 7 Survey of Church Attenders Aged 10-14 Years: 2001 National Church Life Survey J. Bellamy, S. Mou and K. Castle June 2005 Survey of Church Attenders Aged 10-14 Years: 2001 National Church
The Global Religious Landscape
 The Global Religious Landscape A Report on the Size and Distribution of the World s Major Religious Groups as of 2010 ANALYSIS December 18, 2012 Executive Summary Navigate this page: Geographic Distribution
QUESTIONS AND PREVIOUSLY RELEASED OR HELD FOR FUTURE RELEASE
 PEW RESEARCH CENTER FOR THE PEOPLE & THE PRESS AND PEW FORUM ON RELIGION & PUBLIC LIFE 2009 RELIGION & PUBLIC LIFE SURVEY FINAL TOPLINE Survey A: August 11-17, 2009, N=2,010 Survey B: August 20-27, 2009,
Heat in the Melting Pot and Cracks in the Mosaic
 Heat in the Melting Pot and Cracks in the Mosaic Attitudes Toward Religious Groups and Atheists in the United States and Canada by Reginald W. Bibby Board of Governors Research Chair in Sociology University
U.S. Catholics Divided On Church s Direction Under New Pope
 0 February 21, 2013 Reactions to the Papal Resignation U.S. Catholics Divided On Church s Direction Under New Pope FOR FURTHER INFORMATION CONTACT: Alan Cooperman Associate Director, Pew Research Center
Studies of Religion II
 2008 HIGHER SCHOOL CERTIFICATE EXAMINATION Studies of Religion II Total marks 100 Section I Pages 2 11 30 marks This section has two parts, Part A and Part B Allow about 50 minutes for this section Part
Christian camp attendance
 Question Summary Profile For Christian Venues Australia 2011 National Church Life Survey Christian camp attendance A representative sample of church attenders from Catholic, Anglican and other Protestant
Maungakiekie-Tāmaki Local Board Profile. - Initial results from the 2013 Census. February 2014
 Maungakiekie-Tāmaki Local Board Profile - Initial results from the 2013 Census February 2014 Social and Economic Research Team Research, Investigations and Monitoring Unit Auckland Council Map of Maungakiekie-Tāmaki
Pastoral Research Online
 Pastoral Research Online Issue 26 September 2015 How demography affects Mass attendance (Part 2) In the August issue of Pastoral Research Online, we saw that the demography of the local Catholic population
Sociological Report about The Reformed Church in Hungary
 Sociological Report about The Reformed Church in Hungary 2014 1 Dr. Márton Csanády Ph.D. 2 On the request of the Reformed Church in Hungary, Károli Gáspár University of the Reformed Church in Hungary started
MULTIPLE CHOICE. Choose the one alternative that best completes the statement or answers the question.
 Chapter 6 Exam Name MULTIPLE CHOICE. Choose the one alternative that best completes the statement or answers the question. 1) Religion is a good example of the tension between globalization and local diversity
Evangelical Attitudes Toward Israel
 Evangelical Attitudes Toward Israel Representative Survey of 2,002 Americans With Evangelical Beliefs Sponsored by Chosen People Ministries and Author, Joel C Rosenberg 2 Methodology LifeWay Research conducted
The American Religious Landscape and the 2004 Presidential Vote: Increased Polarization
 The American Religious Landscape and the 2004 Presidential Vote: Increased Polarization John C. Green, Corwin E. Smidt, James L. Guth, and Lyman A. Kellstedt The American religious landscape was strongly
U.S. Catholics Happy with Selection of Pope Francis
 0 March 18, 2013 Most Say Addressing Sex Abuse Scandal Should Be a Top Priority for the New Pope U.S. Catholics Happy with Selection of Pope Francis FOR FURTHER INFORMATION CONTACT: Alan Cooperman Associate
A proposed outline of the 2016 National Church Life Survey.
 A proposed outline of the 2016 National Church Life Survey. We invite your feedback. Every five years, since 1991, we have invited local Christian churches in Australia to take part in a National Church
The Fifth National Survey of Religion and Politics: A Baseline for the 2008 Presidential Election. John C. Green
 The Fifth National Survey of Religion and Politics: A Baseline for the 2008 Presidential Election John C. Green Ray C. Bliss Institute of Applied Politics University of Akron (Email: green@uakron.edu;
Studies of Religion I
 2008 HIGHER SCHOOL CERTIFICATE EXAMINATION Studies of Religion I Total marks 50 Section I Pages 2 5 General Instructions Reading time 5 minutes Working time 1 1 hours 2 Write using black or blue pen Write
Changes in the Ethnic Diversity of the Christian Population in England
 National Census 2001 and 2011 Changes in the Ethnic Diversity of the Christian Population in England between 2001 and 2011 South West Region Council for Christian Unity 2014 CONTENTS Foreword from the
American University Student Government Annual Internal Diversity Assessment
 1 2017-18 American University Student Government Annual Internal Diversity Assessment President Yamillet Payano Written by Rafael Cestero, Director of Diversity Equity and Inclusion Executive Summary:
Surveying the Survey: Anglicans and Same-Sex Marriage: Contents
 Surveying the Survey: Anglicans and Same-Sex Marriage: Contents The theological significance of what Christians believe... 1 The survey s goal... 2 Finding the English Anglicans I... 2 Who is included?...
Religious Polarizaation
 Religious Polarizaation Clarifying the Impact of Secularization and Desecularization in Canada and Elsewhere Reginald W. Bibby Toronto - May 30, 2017 ABSTRACT Background Have been at this a long time *
Westminster Presbyterian Church Discernment Process TEAM B
 Westminster Presbyterian Church Discernment Process TEAM B Mission Start Building and document a Congregational Profile and its Strengths which considers: Total Membership Sunday Worshippers Congregational
D. B.I.L.T.: Beliefs. 1. What people believe influence what they do, say, wear, eat, etc.
 D. B.I.L.T.: Beliefs 1. What people believe influence what they do, say, wear, eat, etc. Does this have to be associated with an organized religion? What would be an example of your beliefs influencing
RECOMMENDED CITATION: Pew Research Center, March 2014, U.S. Catholics View Pope Francis as a Change for the Better
 NUMBERS, FACTS AND TRENDS SHAPING THE WORLD FOR RELEASE MARCH 6, 2014 FOR FURTHER INFORMATION ON THIS REPORT: Alan Cooperman, Director of Religion Research Greg Smith, Director of U.S. Religion Surveys
HSC Studies of Religion 1 Life Skills. Year 2016 Mark Pages 23 Published Feb 24, 2017 SOR 1 FULL NOTES 99 ATAR. By Brooke (99.
 HSC Studies of Religion 1 Life Skills Year 2016 Mark 48.00 Pages 23 Published Feb 24, 2017 SOR 1 FULL NOTES 99 ATAR By Brooke (99.05 ATAR) Powered by TCPDF (www.tcpdf.org) Your notes author, Brooke. Brooke
The role of the Church in the local community
 The role of the Church in the local community Why are churches important for the local community? Use your spider diagram to help you write a paragraph in your book explaining why you think churches are
Reflections on Religion, Identity, Crisis and War: New Theory and Data. Patrick James University of Southern California
 Reflections on Religion, Identity, Crisis and War: New Theory and Data Patrick James University of Southern California Outline Religion, IR and CP Theorizing and Hypotheses RCS Dataset Final Thoughts Religion,
JEWISH EDUCATIONAL BACKGROUND: TRENDS AND VARIATIONS AMONG TODAY S JEWISH ADULTS
 JEWISH EDUCATIONAL BACKGROUND: TRENDS AND VARIATIONS AMONG TODAY S JEWISH ADULTS Steven M. Cohen The Hebrew University of Jerusalem Senior Research Consultant, UJC United Jewish Communities Report Series
Congregational Survey Results 2016
 Congregational Survey Results 2016 1 EXECUTIVE SUMMARY Making Steady Progress Toward Our Mission Over the past four years, UUCA has undergone a significant period of transition with three different Senior
Local Churches in Australia Research Findings from NCLS Research
 Local Churches in Australia Research Findings from NCLS Research Dr Ruth Powell Director, NCLS Research Associate Professor, ACU 2016 NCLS Church Life Pack Seminar March and April 2017 For Citation: Powell,
Christian camp importance
 Question Summary Profile For Christian Venues Australia 2011 National Church Life Survey Christian camp importance A representative sample of church attenders from Catholic, Anglican and other Protestant
The Social and Demographic Context for the Anglican Diocese of Melbourne
 The Social and Demographic Context for the Anglican Diocese of Melbourne Introduction Melbourne and Geelong have seen huge changes in the past few years both in terms of their demographics and their social
Studies of Religion II
 2011 HIGHER SCHOOL CERTIFICATE EXAMINATION Studies of Religion II Total marks 100 Section I Pages 2 11 30 marks This section has two parts, Part A and Part B Allow about 50 minutes for this section General
Variable Group: Citizenship Nationality and Religion Variable Sub-Group Religion Canadian Century Research Infrastructure Project
 10000 Christian Worldview 10100 Roman Tradition 10101 Catholic 10102 Roman Catholic 10103 Irish Catholic 10104 French Catholic 10105 Greek Catholic 10106 Polish Catholic 10107 Ukrainian Catholic 10108
A Comprehensive Study of The Frum Community of Greater Montreal
 A Comprehensive Study of The Frum Community of Greater Montreal The following is a comprehensive study of the Frum Community residing in the Greater Montreal Metropolitan Area. It was designed to examine
Wisconsin Longitudinal Study Codebook. relr75: What is your current religious preference?
 Religion relr75 Current religious preference bkxrl4 Currently a church member? bkxrl3 Religious service attendence frequency relfml Main religious preference of family in 1957 relr75: What is your current
LUTHERAN SCHOOLS: A PIECE OF THE AUSTRALIAN EDUCATION PUZZLE
 LUTHERAN SCHOOLS: A PIECE OF THE AUSTRALIAN EDUCATION PUZZLE (A paper given at the 1999 Australian Conference on Lutheran Education by Adrienne Jericho, National Director for Lutheran Schools) Although
Religious Groups in the 2010 U.S. Religion Census: Religious Congregations & Membership Study
 (Original) Church of God Adidam African Methodist Episcopal Church African Methodist Episcopal Zion Church Ajapa Yoga Foundation (North American HQ) Albanian Orthodox Diocese of America All World Gayatri
Why Churches Get Stuck At 200
 Why Churches Get Stuck At 200 Stuck Churches In America One might ask the question, How does the stuck church scenario effect the church in general? In other words, are there many stuck churches on the
Evangelical Attitudes Toward Israel Research Study
 Evangelical Attitudes Toward Israel Research Study Evangelical Attitudes Towards Israel and the Peace Process Sponsored By Chosen People Ministries and Author Joel C. Rosenberg Table of Contents Page Executive
Religion and faith in Canada today: strong belief, ambivalence and rejection define our views
 Religion and faith in Canada today: strong belief, ambivalence and rejection define our views Page 1 of 46 Largest group puts itself in the mushy middle on, ranks of those embracing faith are shrinking
NOTE: QUESTION NUMBERING IS NOT CONTINUOUS BECAUSE SOME ITEMS HAVE BEEN PREVIOUSLY RELEASED OR HELD FOR FUTURE RELEASE
 PEW RESEARCH CENTER FOR THE PEOPLE & THE PRESS AND PEW FORUM ON RELIGION & PUBLIC LIFE 2009 RELIGION & PUBLIC LIFE SURVEY FINAL TOPLINE Survey A: August 11-17, 2009, N=2,010 Survey B: August 20-27, 2009,
American Values Atlas 2016 January 6, 2016 January 10, 2017 N = 101,438
 American Values Atlas 2016 January 6, 2016 January 10, 2017 N = 101,438 RELIG What is your present religion, if any? Are you Protestant, Roman Catholic, Mormon, Orthodox such as Greek or Russian Orthodox,
Changes in the Ethnic Diversity of the Christian Population in England
 National Census 2001 and 2011 Changes in the Ethnic Diversity of the Christian Population in England between 2001 and 2011 West Midlands Region Council for Christian Unity 2014 CONTENTS Foreword from the
Faith and Belief in New Zealand MAY
 Faith and Belief in New Zealand MAY 2 0 1 8 2 Contents Research objectives 4 Research methodology 4 Executive summary 7 Religion in New Zealand 10 Spirituality in New Zealand 24 Discussing spirituality
The Reform and Conservative Movements in Israel: A Profile and Attitudes
 Tamar Hermann Chanan Cohen The Reform and Conservative Movements in Israel: A Profile and Attitudes What percentages of Jews in Israel define themselves as Reform or Conservative? What is their ethnic
Restless Gods and Restless Youth: An Update on the Religious Situation in Canada
 Restless Gods and Restless Youth: An Update on the Religious Situation in Canada by Reginald W. Bibby Board of Governors Research Chair Department of Sociology University of Lethbridge Lethbridge, AB T1K
Byron Johnson February 2011
 Byron Johnson February 2011 Evangelicalism is not what it used to be. Evangelicals were once derided for being uneducated, unsophisticated, and single-issue oriented in their politics. Now they profess
Modern Muslim Word Map - Lesson Plan
 Modern Muslim Word Map - Lesson Plan 1.) In this lesson, students will calculate the percentage of Muslims that live in regions around the world. The goal is for students to recognize the areas that are
Pastor Views on LGBT Serving and Marriage Requests. Survey of Protestant Pastors
 Pastor Views on LGBT Serving and Marriage Requests Survey of Protestant Pastors 2 Methodology The phone survey of Protestant pastors was conducted March 9-24, 2016 The calling list was a stratified random
Key Issue 1: Where Are Religions Distributed?
 Key Issue 1: Where Are Religions Distributed? Pages 183-191 ***Always keep your key term packet out whenever you take notes from Rubenstein. As the terms come up in the text, think through the significance
HUMAN GEOGRAPHY. By Brett Lucas
 HUMAN GEOGRAPHY By Brett Lucas RELIGION Overview Distribution of Religion Christianity Islam Buddhism Hinduism Religious Conflict Distribution of Religions Religion & Culture Everyone has values and morals
Christianity in its Global Context, Society, Religion, and Mission
 Christianity in its Global Context, 1970 2020 Society, Religion, and Mission June 2013 About the Center for the Study of Global Christianity This report was produced by the located at Gordon-Conwell Theological
Teaching SRE a brochure providing a quick guide for new SRE teachers.
 8 Resources for SRE This chapter provides a list of resources for those involved in SRE. Many of the resources can be found on the ICCOREIS website: www.iccoreis.asn.au/resources which contains promotional
Burial Christians, Muslims, and Jews usually bury their dead in a specially designated area called a cemetery. After Christianity became legal,
 Burial Christians, Muslims, and Jews usually bury their dead in a specially designated area called a cemetery. After Christianity became legal, Christians buried their dead in the yard around the church.
FACTS About Non-Seminary-Trained Pastors Marjorie H. Royle, Ph.D. Clay Pots Research April, 2011
 FACTS About Non-Seminary-Trained Pastors Marjorie H. Royle, Ph.D. Clay Pots Research April, 2011 This report is one of a series summarizing the findings of two major interdenominational and interfaith
HeRB: Herb's Research Bulletin Revised October 2011 Number 7 September 2003 (
 HeRB: Herb's Research Bulletin Revised October 2011 Number 7 September 2003 (http://www.herbswanson.com/_get.php?postid=23.php#article4) Ministry and Globalisation in Australia Philip Hughes My home is
Research and Evaluation, Office of the Presiding Bishop Evangelical Lutheran Church in America December 2017
 A Statistical Overview of the Southeastern Pennsylvania Synod With comparisons to Northeastern Ohio (6E), Southern Ohio (6F), Northeastern Pennsylvania (7E), and Lower Susquehanna Synod (8D) Research and
Mind the Gap: measuring religiosity in Ireland
 Mind the Gap: measuring religiosity in Ireland At Census 2002, just over 88% of people in the Republic of Ireland declared themselves to be Catholic when asked their religion. This was a slight decrease
Diverse Faiths of Tasmania
 Diverse Faiths of Tasmania Multicultural Council of Tasmania Multicultural Council of Tasmania 40 Melville St Hobart TAS 7000 GPO Box 798 Hobart TAS 7001 Phone 03 6285 9907 Email office@mcot.org.au Facebook
COMPARATIVE RELIGIONS H O U R 1
 COMPARATIVE RELIGIONS H O U R 1 EASTERN & WESTERN RELIGIONS Eastern (Asian based wisdom traditions) Buddhism Hinduism Taoism Confuciansim Western (Really middle eastern traditions ) Judaism Christianity
Studies of Religion I
 2009 HIGHER SCHOOL CERTIFICATE EXAMINATION Studies of Religion I Total marks 50 General Instructions Reading time 5 minutes Working time 1 1 2 hours Write using black or blue pen Write your Centre Number
U.S.Religious Landscape Survey
 U.S.Religious Landscape Survey 2008 About the Pew Forum on Religion & Public Life This report was produced by the Pew Forum on Religion & Public Life. The Forum delivers timely, impartial information on
Curriculum in Australian Islamic Schools: Trends & Future Prospects
 Presented By Aynur Simsirel Principal Advisor Curriculum in Australian Islamic Schools: Trends & Future Prospects Independent Schools Victoria 2015. All rights reserved. July2017 / Agenda 1. Snapshot of
Over the last years all of us have watched the geography of the
 1. Things Have Changed, or Toto, We re Not in Kansas Any More Over the last years all of us have watched the geography of the American church undergo a radical transformation. It s almost as if there has
Focusing the It s Time Urban Mission Initiative
 63 CLYDE MORGAN Focusing the It s Time Urban Mission Initiative Following the Mission to the Cities emphasis during the current quinquennium from 2010-2015, the 2013 Annual Council of the Seventh-day Adventist
IMPORTANT STATS FOR MINISTRY IN
 8 IMPORTANT STATS 2018 FOR MINISTRY IN Introduction: In a recent issue, editor-in-chief Carol Pipes writes this: The world has changed since I was a kid. I remember a time when all my neighbors went to
Appendix D: Question wording from each survey
 81 Appendix D: Question wording from each survey The analysis of religious identity in this report distinguished between those who identify with a religion and those who do not. Pew Research Center surveys
THE BRETHREN: An Investigation into Marriage and Family Relations Among the Plymouth Brethren (Exclusive Brethren) in Australia
 in Australia") THE BRETHREN: An Investigation into Marriage and Family Relations Among the Plymouth Brethren (Exclusive Brethren) in Australia Gary D Bouma, BA, BD, MA, PhD Professor of Sociology UNESCO Chair in Interreligious
THE BRETHREN: An Investigation into Marriage and Family Relations Among the Plymouth Brethren (Exclusive Brethren) in Australia Gary D Bouma, BA, BD, MA, PhD Professor of Sociology UNESCO Chair in Interreligious
THE QUEEN. on the application of:
 Ref:- DRO/AJG/BRI-20409-001 On behalf of the Claimant Witness Statement of David Voas IN THE HIGH COURT OF JUSTICE QUEEN S BENCH DIVISION ADMINISTRATIVE COURT IN THE MATTER OF AN APPLICATION FOR JUDICIAL
Factors related to students focus on God
 The Christian Life Survey 2014-2015 Administration at 22 Christian Colleges tucse.taylor.edu Factors related to students focus on God Introduction Every year tens of thousands of students arrive at Christian
C) 1. Ask the students to compile a list of cultural characteristics that they associate with South Asia.
 1. Ask the students to compile a list of cultural characteristics that they associate with South Asia.") COMPARING AND CONTRASTING FOUR MAJOR RELIGIONS OF SOUTH ASIA Beth Moulder Purpose: This lesson will increase an understanding of the culture of the people of South Asia and their religious practices. Objectives:
COMPARING AND CONTRASTING FOUR MAJOR RELIGIONS OF SOUTH ASIA Beth Moulder Purpose: This lesson will increase an understanding of the culture of the people of South Asia and their religious practices. Objectives:
Nonreligious. A1. How would you describe the overall contribution religious and faith communities are making to Canada and Canadian society today?
 Very More A More Very op2box Some t op2box More As Becoming op2box Regional sample sizes are unweighted. All other sample sizes, including totals, are weighted to census data. Blank cells indicate zero
Perception about God and Religion within the Malaysian Society
 Doi:10.5901/mjss.2015.v6n1s1p246 Abstract Perception about God and Religion within the Malaysian Society Mohd Arip Kasmo 1 Abur Hamdi Usman 2* Zulkifli Mohamad 1 Nasruddin Yunos 1 Wan Zulkifli Wan Hassan
Britain s Jewish Community Statistics 2010
 Britain s Jewish Community Statistics 2010 Daniel Vulkan Board of Deputies of British Jews April 2012 Contents Executive summary... 3 Introduction... 5 Births... 6 Marriages... 9 Divorces... 13 Deaths...
Survey of Church Members
 Survey of Church Members conducted for the Allegheny East Conference of the Seventh-day Adventist Church Bradford-Cleveland-Brooks Leadership Center Oakwood University August 2008 Introduction A random
Jacob Neusner, ed., World Religions in America 3 rd edition,
 THE NEW (AND OLD) RELIGIONS AROUND US Lay School of Religion Luther Seminary February 7 to March 7 Mark Granquist February 7 - Schedule of Our Sessions Overview on American Religion Judaism February 14
Summary Christians in the Netherlands
 Summary Christians in the Netherlands Church participation and Christian belief Joep de Hart Pepijn van Houwelingen Original title: Christenen in Nederland 978 90 377 0894 3 The Netherlands Institute for
The changing religious profile of Asia: Other Religions and the Irreligious
 The changing religious profile of Asia: Other Religions and the Irreligious In this final note on the religious profile of Asia, we describe the changing share and distribution of Ethnic Religions, some
THERE is an obvious need for accurate data on the trend in the number of. in the Republic of Ireland, BRENDAN M. WALSH*
 Trends in the Religious in the Republic of Ireland, Composition of the Population BRENDAN M. WALSH* Abstract: Compared with 1946 there were more Catholics in the Republic in 1971 but 24 per cent fewer
The changing religious profile of Asia: Buddhists, Hindus and Chinese Religionists
 The changing religious profile of Asia: Buddhists, Hindus and Chinese Religionists We have described the changing share and distribution of Christians and Muslims in different parts of Asia in our previous
National Quali cations
 H 2017 X764/76/11 National Quali cations Religious, Moral and Philosophical Studies MONDAY, 22 MAY 9:00 AM 11:15 AM Total marks 60 SECTION 1 WORLD RELIGION 20 marks Attempt ONE Part SECTION 2 MORALITY
Key Issue 1: Where Are the World s Religions Distributed?
 Revised 2018 NAME: PERIOD: Rubenstein: The Cultural Landscape (12 th edition) Chapter Six Religions (pages 182 thru 227) This is the primary means by which you will be taking notes this year and they are