Executive Summary... 3 Research Design... 3 Summary of Results... 3 Introduction... 5 Purpose... 5 Objectives... 5 Chile Background Information...
|
|
|
- Evangeline Bailey
- 6 years ago
- Views:
Transcription


1 Chile
2 Executive Summary... 3 Research Design... 3 Summary of Results... 3 Introduction... 5 Purpose... 5 Objectives... 5 Chile Background Information... 6 Project Components... 7 Definitions... 7 Personnel... 8 Methods... 9 Survey... 9 Sample Size... 9 Sampling Strategy Data Collection Results Describing the Sample Ministry Focus Programs (Churches and NGOs) Program Categories Technology Secondary Impact Reach Limitations Acknowledgements Appendix A OneHope s Definition of Missional Reach Appendix B Chile Asset Mapping Survey Appendix C Key Ministries
3 EXECUTIVE SUMMARY Research Design In April 2013, this national, market evaluation study was begun in Chile to describe, measure, and evaluate Christian ministry activities and services directed toward children and youth from the ages of 5- and 19-years-old in the country. This study is part of a broader effort led by OneHope, involving 40 countries from This study reveals a national picture of the children and youth ministry sector, highlighting (a) key stakeholders and exemplars, (b) priority and commitment placed on children and youth, (c) programs and activities utilized, and (d) the average number of children and youth being reached by the ministry sector. Nationally representative samples of Protestant churches and Christian non-government organizations (NGOs) were surveyed to allow for an approximate calculation of annual Reach the total number of children and youth reached with the Gospel and to identify geographic or demographic gaps where children and youth are not being reached. This study also serves to describe the types of programs (including evangelism, mercy ministry, etc.) being implemented by churches and NGOs and their frequency of use. This national, market evaluation study is intended to provide information to leaders of ministries and churches so that they may efficiently direct their efforts and improve coordination and partnership to serve as many children and youth with the Gospel as resources allow. Results will also guide future OneHope efforts in Chile. Summary of Results Describing the Sample Complete surveys were received from 392 ministry organizations (including 341 churches and 45 NGOs). This study included a diverse group of Protestant churches, representing a wide range of denominations, geographic locations, population densities (i.e., rural, suburban, and urban), and church sizes, as shown in the charts below. Participating churches were representative of the main denominations in Chile and were located throughout all major regions of Chile. The majority of participating churches were located in urban areas of higher population density. Ministry Focus Churches belonging to an Independent denomination and churches belonging to an Apostolic, Independent Pentecostal denomination were less likely to focus on children ages 5 11 than were churches belonging to a Historic denomination. Larger churches were more likely than were smaller churches to focus on youth ages Programs There was only one significant relationship between church programs for children (ages 5 11) and region revealed by the analysis: churches in the Norte Grande region, more often than did churches in other regions, reported having a literacy program. Similarly, there was only one significant relationship discovered between region and youth programs (ages 12 19): churches in Norte Grande reported using scripture distribution programs more frequently than did 3
4 churches in the Zona Central and Zona Sur regions. Churches with larger weekly attendance were more likely than were smaller churches to have Sunday schools and large evangelistic gatherings/festivals for children ages Larger churches were also more likely to report having camps or retreats than were smaller churches. Program Categories Almost all churches conducted evangelism and/or discipleship programs for children ages 5 11, and less than half of the churches conducted evangelism and/or benevolence programs for children ages A greater proportion of churches in the region of Norte Grande reported an evangelism and discipleship program compared to churches in the region of Zona Central. A greater proportion of churches with large attendance reported an evangelism and benevolence program when compared to churches with smaller attendance. Technology Churches were most likely to use social media and video technology and rarely used websites. Youth attendees, ages 12 19, were most likely to use cell phones and video equipment. However, they were the least likely to use smart phones. Secondary Impact Churches were most likely to conduct food programs and least likely to conduct water or sanitation programs. NGOs were most likely to conduct food programs and health programs and least likely to conduct micro-finance programs and water or sanitation programs. A greater proportion of churches in suburban areas reported having food programs when compared to churches in urban areas. Reach Based on self-reported Reach numbers across the national sample, Reach was estimated for children and youth across Chilean Protestant churches. Direct Gospel Reach (not including indirect Reach, such as Reach by radio, etc.) for the NGO sample was 1,478. This is a self-reported cumulative figure, which was based on targeting the largest Christian-, child-, and youth-focused NGOs in Chile in advance. Direct Gospel Reach for churches was calculated by multiplying median church Reach (10 for children and youth combined) by the number of Protestant and Evangelical churches reported by Operation World (21,648). Adding the total national church Reach (216,480) to the total national NGO Reach (1,478) estimated a cumulative Reach of 217, This number is limited by the inability to examine broader trends in media, possibly under-surveying key NGOs, and the decision to limit church surveys to Protestant congregations. 1 Reach calculations should be considered as preliminary and are subject to further adjustment based on such factors as incorporating actual mega-church reach and further clarification from participating ministries. 4
5 INTRODUCTION Purpose OneHope s mission is to affect destiny by providing God s eternal Word to all the children and youth of the world. That can be accomplished only through collaboration with the many churches and other organizations that are ministering to children and youth. As a tool to catalyze that kind of collaboration, OneHope is sponsoring this global study to describe the current state of institutional (church and NGO) ministry to children and youth (ages 5 19) in 40 countries. 2 The purpose of this study is twofold: Promote Understanding Complete a global study of the work of churches and Christian ministry organizations with children and youth to better understand which and how many children and youth are being reached with the Gospel. Catalyze Impact Identify key institutions serving children and youth as an informational and collaborative tool for pastors and practitioners toward better ministry, partnership, and impact. The three objectives of this study are as follows: Objectives To identify organizations that are involved, influential, important, impactful, and innovative to share information and to highlight people, programs, and practices that might serve the broader global church. 3 To describe the types of programs (e.g., evangelism, discipleship, and benevolence) being implemented to improve coordination among ministries and to identify both strengths and gaps in current ministry types and models, which may present opportunities for future ministry. To measure and map the percentage of children and youth being actively reached with the Gospel (Reach) in order to estimate progress in reaching all children and youth and to identify geographic or demographic gaps where children and youth are not being reached. To these ends, data were collected and will be popularized and made freely available to a broad national and international audience of ministry practitioners. 2 Partnership and feedback on the global project has been given by a number of key ministry networks and partner organizations invested in working with children and youth. 3 Except where authorization has been given to publish specific ministry names and/or data, confidentiality of all participating organizations is guaranteed. 5

6 Chile Background Information Chile stretches down the southwestern coast of South America. 4 The climate is temperate with desert land in the north, a central Mediterranean region, and a cool, damp, southern region. The Andes Mountains line the eastern border. Chile has been steadily growing since the 1980s as a result of good economic policy. The poverty rate has decreased by more than half. Chile has maintained free elections since 1990 and is an exemplar of representative government. The official language is Spanish. Mapudungun, German, and English are also spoken. Ethnic groups include White and White Amerindian (95.4%), Mapuche (4%), and Other Indigenous Groups (.6%). Chile s population of 17,216,945 is comprised of 89.4% Christian,.1% Muslim, 8.6% unaffiliated, 1.5% folk religions, and.2% other (See Figure 0.1). Nearly 21% of Chile s total population is comprised of youth aged 14 and under (See Figure 0.2), and according to a 2010 study, approximately 89% of the total population lives in an urban area, particularly Santiago and Valparaiso. Figure 0.1 Chile Religions Unaffiliated 8.6% Muslim.1% Folk Religions 1.5% Other.2% Christian 89.4% 4 This report relies upon population, demographic, and economic data from the United States Central Intelligence Agency World Factbook. (2014). Chile. Retrieved from 6
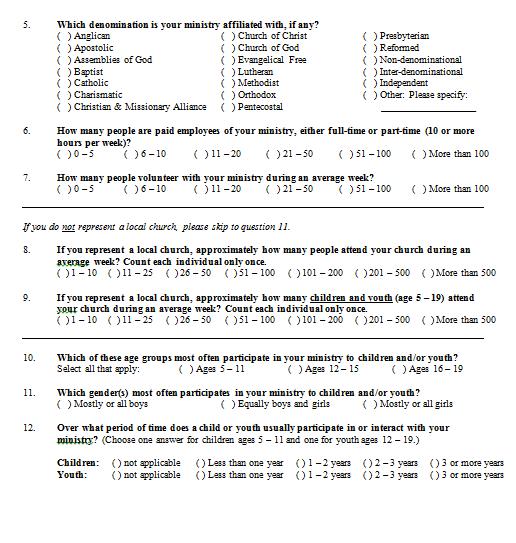
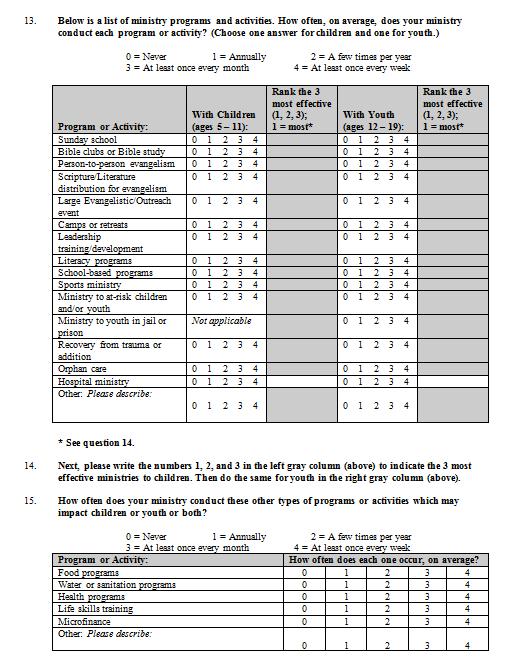
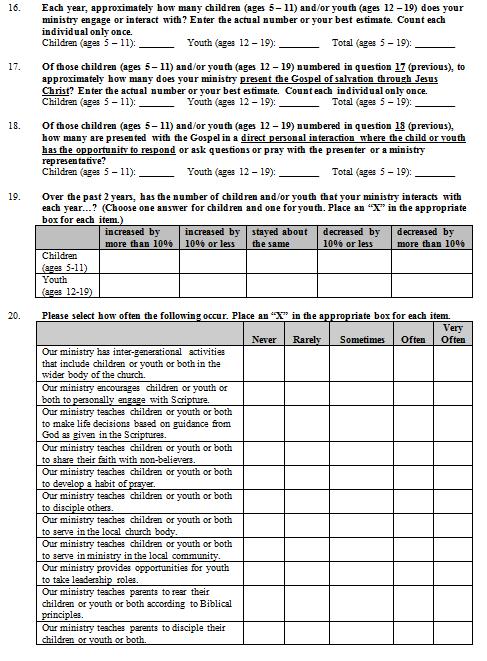
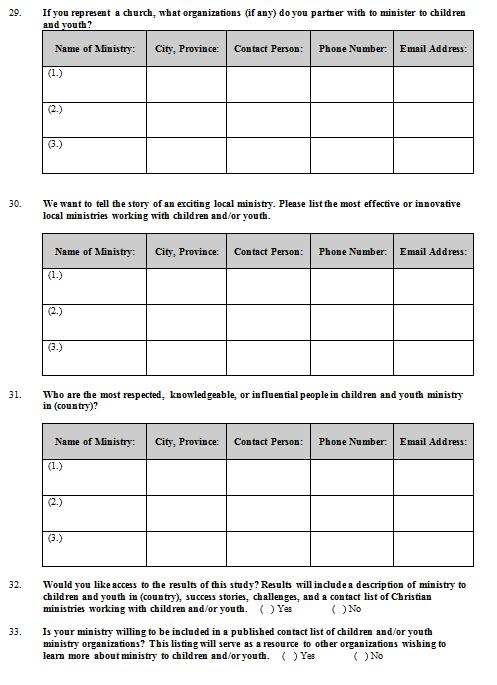
7 Figure 0.2 Chile Populations by Age 65 Years & Older 9.7% % % % % Administrative divisions include 15 regions. Project Components Survey of Churches and Survey of NGOs A survey was designed and administered to pastors and leaders of churches, and to leaders and representatives of Christian ministry organizations reaching children and youth (NGOs) throughout Chile. Interviews with Ministry Leaders In-depth interviews are being conducted with influential leaders of ministry organizations and churches during the 2014 calendar year. At the conclusion of these interviews, an updated report will be released. Definitions Ministries Christian organizations, including churches and NGOs that deliver programming (educational, religious, practical, or otherwise) to children and/or youth. NGOs Non-government organizations, including non-profit organizations, schools, networks, foundations, and para-church organizations, etc. Reach Presenting the Gospel of salvation through Jesus Christ in the context of a direct, personal interaction in which the child or youth has the opportunity to respond, ask questions, or pray with the presenter or a ministry representative. 5 5 Adapted from OneHope s Definition of Missional Reach (Appendix A). 7
8 Personnel The National Project Coordinator (NPC) facilitated this study and oversaw survey administration and interviews throughout Chile. Survey administrators surveyed church and NGO representatives. Data entry staff transmitted survey data to the International Project Coordinator. The NPC or other trained interviewers interviewed church and NGO ministry leaders. 8
9 METHODS Survey The Chile Asset Mapping Survey (Appendix B) was adapted from OneHope pilot studies performed in Uganda (2011) and the Philippines (2012), 6 as well as similar studies conducted with the European Evangelical Alliance in four European Countries (2012). The survey was designed to be completed in paper form by any church, ministry, school, or other institution serving children or youth. On the survey, each organization was asked to provide the following information: Personal and ministry contact information City, town, or village demographics Religious affiliation Number of people employed by ministry Number of people regularly attending service (for churches only) Target age groups Number of children and youth impacted annually Ministry programs Ministry format (face-to-face vs. indirect; number of ministry opportunities with each child or youth; duration of ministry with each child or youth) Technology use of ministry and of the children and youth served Geographic location(s) of ministry activities Usage of OneHope products Questions about the spiritual content of ministry activities were based on elements of OneHope s internal definition of missional Reach (Appendix A), which could be reasonably assessed through a survey. Sample Size Sampling methods differed for churches and NGOs. When surveying churches, the goal was to draw a representative sample of all churches in the country. The number of churches surveyed was sufficient to draw a representative sample of the estimated total number of churches 7 with 6 In subsequent asset mapping projects, additional survey questions were included in the standard asset mapping survey. Questions pertaining to discipling and equipping youth were adapted from a European Evangelical Alliance ministry survey developed in partnership with OneHope. Finally, questions pertaining to the acceptability of digital ministry tools were newly written for the survey. These questions were not included on the Chile asset mapping survey. 7 As estimated by Operation World. Mandryk, & Jason. (2010). Operation World: The Definitive Prayer Guide to Every Nation (7th ed.). Westmont, IL: InterVarsity Press. 9
10 a 95.0% level of confidence and a 5.0% margin of error. For example, in a country like Chile with approximately 21, 648 churches, a random sample of 377 churches was required. In contrast, the inability to obtain a representative sample of NGOs was the primary reason the project team eventually concluded that country level asset mapping is best served by inclusion of data from the largest organizations willing to participate. In that way, findings from even a few organizations will be descriptive of the largest possible numbers of children and youth affected by the work of these organizations. Sampling Strategy A comprehensive national list of churches from which to draw a random sample was not available. Therefore, a proportional quota sample 8 was used in which the sample was representative of churches throughout the country. The desired number (or quota) of churches to survey was established for each geographic region, as described below. To increase representativeness of the sample, attempts were also made to include churches with a variety of denominations, urban and rural locations, and congregation sizes (including relatively small, medium, and large churches). Geographic Region States (or provinces, departments, etc.) were grouped into regions based on existing regional boundaries (geographic, religious, cultural, linguistic, or other similarities among states) and the advice of in-country experts. In most countries, sampling was conducted in all regions. Next, up to four states in each region were selected semi-randomly. 9 The selection included states with a variety of population sizes within each region but was biased toward the largest states. Finally, up to four counties (or local government areas, municipalities, districts, etc.) were selected semi-randomly within each selected state, following the same approach as that for selecting states. There is likely to be more Christian ministry to children and youth in places with a higher proportion of Christians. Therefore, the target sample size in each region, state, or county was proportional to the population size in that area, adjusted for the estimated percent of the population who are Christian 10 (more Christians equals a larger sample size, and vice versa) where data on religious affiliation were available. In most countries, data on religious affiliation were available for the regional level only. 8 Food and Agriculture Organization. Examples of Sampling Methods. Downloaded 30 May, 2013 from 9 In Chile, a more thorough sampling approach was used in which churches were surveyed in all 37 states, including the Federal Capital Territory. 10 World Christian Database: Downloaded May 2013 from 10
11 Denomination This study was focused on Protestant denominations, including Mainline Protestants, Evangelicals, Pentecostals, and Independents, as well as Orthodox organizations. When surveying churches and NGOs, survey administrators were encouraged to include a variety of denominations. The NPC was also provided with proposed denominational quotas for the survey of churches, which included the largest Protestant and Independent denominations in the country. 11 Denominational quotas were secondary to geographic quotas. Denominational quotas for the survey of churches were established in two steps. First, the quota for each denominational group (e.g., Mainline Protestant) was calculated to be proportional to the estimated number of Christians in the country who were affiliated with that denominational group. 12 Second, quotas were calculated for the largest denominations (e.g., Baptist) within each group in proportion to the estimated number of Christians affiliated with each denomination. 13 Because regional data on denominational affiliation were generally not available, only a national quota was used. Surveys were only administered to churches or NGOs that identified themselves as Christian. Unaffiliated Christian churches were classified as Protestant. Rural or Urban Location The number of churches to survey in rural and urban areas was proportional to the percentages of the national population living in rural and urban areas, respectively. Suburban churches were classified as urban. Data Collection The survey was administered to church pastors, youth pastors, ministry leaders, or other representatives of churches and Christian NGOs from October of 2013 to December of Identifying Churches to Survey To fulfill the church sampling quotas described above, field staff visited the selected states and counties within each region. However, flexibility was allowed in the location and number of surveys conducted at the state and county levels. This ensured an adequately diverse sample that was representative at both the regional and national level (in each report, results are presented only at the regional and national levels, not at the state or county levels). Field staff then identified churches to survey from among the eligible churches within each geographic area. Staff sought to include a variety of denominations and church sizes, including rural and urban churches, and avoided being biased by personal preferences for certain denominations, worship styles, languages, etc. In some other countries, the following sampling methods were also used as needed, while still adhering to the pre-determined quotas: Convenience Sampling The survey was distributed during relevant conferences or other gatherings, via network or denominational lists, or to pre-existing contacts. 11 Mandryk, & Jason. (2010). Operation World: The Definitive Prayer Guide to Every Nation (7th ed.). Westmont, IL: InterVarsity Press. 12 Ibid. 13 Ibid. 11
12 Random Selection When a listing of all churches in a country was available, churches were randomly selected and the survey was conducted by phone or in person. Identifying NGOs to Survey In addition to surveying the Christian NGOs reaching the largest number of children and youth in each country, in some cases, the survey was also administered to NGOs identified via convenience sampling of contacts or networks, snowball sampling (in which respondents provide contact information for additional respondents to survey), or both. Data Entry and Evaluating Quotas Completed paper surveys were copied into an online database (using Survey Gizmo 14 ) as quickly as possible to allow ongoing monitoring of geographic quotas throughout the data collection process. When possible, geographic quotas were evaluated on a regular basis, and when necessary, field sampling methods were adjusted to compensate for discrepancies in meeting quotas. The sample proportions sought to be within 5.0% of each of the quota established for each geographic region. In-Depth Interviews In-depth interviews will be conducted with denominational leaders, national ministry leaders, and other influential individuals in service and ministry to Chilean children and youth. Interviewees will be identified by stakeholders and from recommendations received in completed surveys. When the analysis of interview data is complete, results will provide insight into key areas of child and youth ministry in the country, including strengths and opportunities, weaknesses and challenges, recent trends, and examples of outstanding ministries. Analysis Data were entered from paper surveys into Survey Gizmo, an online survey development and data collection website. Exported data were analyzed in IBM SPSS (Statistical Package for the Social Sciences) and in Microsoft Excel. Data Cleaning Data cleaning began with 409 completed survey responses. After removal of participants based upon missing data, duplicate responses, and other data-related issues, the final number of ministries under study was 392 (341 churches and 45 NGOs). Data about the number of children and youth reached annually were cleaned by averaging ranges (i.e., becomes 250) and converting non-numeric text to numeric responses ( two hundred becomes 200 ). Any vague answers, such as many or few were set to missing. Responses such as 100 or more were conservatively recoded to the low end of the range, which would be 100 in this example. In Chile, all responses reporting over 300 children and youth reached were investigated to guard against incorrect responses and possible misunderstandings. Local knowledge and follow-up contact by the NPC suggested that all of these relatively high reach totals reported on the surveys were accurate
13 Calculating Reach Each organization was asked how many children and youth with whom their ministry engages or interacts. The numbers of children and youth reached, hereafter referred to as Reach, was adjusted for Content, Indirect Reach, and Time: Content Respondents were asked to estimate the number of children and youth they reach who are presented the Gospel of salvation through Jesus Christ. Direct Reach Respondents were asked to estimate the number of children and youth they have direct personal interaction with where the child or youth can respond to, ask questions, or pray. Time Where an organization spent more than one year with a child or youth (Question 20), Reach was reduced (e.g., if a ministry worked with each child for three years, annual Reach was divided by three). NGO Reach through Local Churches Where an NGO reported that all or some of its work was conducted through local churches, the total reach was reduced accordingly. This is based on an assumption that the children reached by local churches would be captured by the local church reach figures. After making the adjustments above, the national children and youth Reach of all churches in Chile ( Church Reach ) was estimated by multiplying the median Reach for all churches in the survey by the estimated number of churches in Chile. 15 National children and youth Reach was estimated by adding the Reach of surveyed NGOs to the national Church Reach. 15 As estimated by Operation World. Mandryk, & Jason. (2010). Operation World: The Definitive Prayer Guide to Every Nation (7th ed.). Westmont, IL: InterVarsity Press. 13
14 RESULTS Describing the Sample This section describes ministries that participated in the survey and includes statistical testing results to understand and describe relationships. The number of ministries that responded to specific questions is included in the charts/tables. Where statistically significant differences were identified, figures will show an asterisk (*) where appropriate, and details are provided in footnotes. A statistically significant finding is one that is determined (statistically) to be very unlikely to happen by chance. Statisticians are able to calculate the likelihood that any observed relationship between two variables (as indicated by any number of cases) could have happened by chance (or random variation). If it is calculated that there is less than a 1 in 20 chance (p.05) that the observed relationship could have happened by chance, the findings are considered significant. If there is less than a 1 in 100 chance (p.01), the findings are considered highly significant. Furthermore, a Cramer s V indicates the effect size or strength of the relationship between the variables. Cramer s V.251 à Very strong relationship à Strong relationship à Moderate relationship à Weak relationship à No or negligible relationship Frequency: Description of Churches and NGOs Frequency by Ministry Type Of the ministries that were surveyed, 341 (88.3%) were from local churches, 22 (5.7%) were NGOs, 12 (3.1%) were non-church ministries, and 11 (2.8%) were captured in the Other category (Figure 1.1A). Figure 1.1B summarizes these data after grouping local churches and Christian NGO, non-profit, or other ministries together. Of the ministries surveyed, 341 (88.3%) were local churches, and 45 (11.7%) were Christian NGO, non-profit, or other ministries. 14
15 Figure 1.1A Ministry Type Local Churches 88.3% NGO 5.7% Non-Church Ministry 3.1% Other 2.8% N = 386 Figure 1.1B Recoded Ministry Type Local Churches 88.3% NGOs 11.7% N = 386 The study included a diverse group of churches, representing the full range of major denominations in the country, geographic regions, and church sizes, as shown in the charts below. The majority of churches and NGOs surveyed were located in urban or suburban areas. Only 11 total churches (8) and NGOs (3) were located in rural areas. Since this number is too small for valid statistical analysis, all analysis specifically conducted on the population, with the exception of the general descriptive information, excludes rural churches and NGOs. Geography: Description of Churches and NGOs Before 1974, Chile was divided into 25 provinces. Currently, the country is divided into 15 regions. In some contexts, the 15 official regions (hereafter referred to as official regions ) are grouped into four geopolitical zones or regions: Norte Chico, Norte Grande, Zona Central, and Zona Sur (hereafter referred to as recoded regions or simply regions ). 16 Given the sample size in the 16 Regions (recoded) run north to south as follows: Arica y Parinacota, Tarapaca, Antofagasta, and Atacama make up Norte Grande. Coquimbo and Valparaiso make up Norte Chico. Santiago Metropolitan, Libertador, Maule, and Biobio make up Zona Central. Araucaunia, Los Rios, and Los Lagos make up Zona Sur. And Aisen and Magallanes make up Zona Austral. 15

16 current study, many of the 15 official regions would not retain a sufficient number of ministries from the data to perform analysis. Therefore, the 4 recoded regions are used in this report. Relative frequencies of observations, as well as spatial proximity and socio-cultural similarity, were the primary considerations in aggregation decisions. By design, the number of churches surveyed in each official region and recoded region was proportional to the estimated Christian population size in that region (for details, see the Methods section). Therefore, more churches were surveyed in the Zona Central than were churches in other regions. NGOs were also surveyed in all regions of the country. However, the focus was on surveying those NGOs which reach the largest number of children and youth, and many of these NGOs were headquartered in the Zona Central. Therefore, as shown in Figure 1.3, the Zona Central has the highest NGO representation (60.0%) of surveyed ministries. Geographic Regions Figure 1.2 Geographic Regions 16
17 Before 1974, Chile was divided into 25 provinces. Currently, the country is divided into 15 regions. Given the sample size in the current study, many of the 15 regions would not retain a sufficient number of ministries from the data to perform analysis. Therefore, the 15 regions were aggregated into 4 recoded regions: Norte Chico, Norte Grande, Zona Central, and Zona Sur. 17 Relative frequencies of observations, spatial proximity, and socio-cultural similarity were the primary considerations in aggregation decisions. Churches and NGOs by Geographic Region The numbers of churches and NGOs surveyed in each of the 12 geographic regions are summarized in Figure 1.3. Figure 1.3 Sample by Geographic Region Region Local Churches NGOs N % N % Santiago Metropolitan Valparaiso O Higgins Maule Antofagasta Arica y Parinacota Atacama Biobio Los Lagos Tarapaca Coquimbo Araucaunia Total Churches and NGOs by Recoded Geographic Region The numbers of churches and NGOs surveyed by recoded geographic region are summarized in Figure 1.4. For the church programs and NGOs that were recoded, there was no significant relationship between ministry type and the four geographic regions. Figure 1.4 Sample by Recoded Geographic Region Region Local Churches NGOs N % N % Norte Chico Norte Grande Zona Central Zona Sur Total Norte Chico: Coquimbo and Valparaiso; Norte Grande: Antofagasta, Arica y Parinacota, Atacama, and Tarapaca; Zona Central: Biobio, Maule, O Higgins, and Santiago Metropolitan; Zona Sur: Araucaunia, Los Lagos, and Los Rios. Regions not noted here did not appear in the data. 17
18 Market Population: Description of Churches and NGOs Churches and NGOs by Ministry Area Population Density Churches were asked to respond to the statement "The location of your ministry headquarters is considered to be: Rural, Suburban, Urban?" As shown in Figures 1.5 and 1.6, the majority of churches and NGOs surveyed were located in urban areas. A total of 8 churches and 3 NGOs were surveyed in rural areas. Due to the small sample size and the lack of validity for combining with suburban areas, the population variable for used for analysis throughout the current report only includes suburban and urban. Of the churches that were surveyed, 45 (13.5%) churches reported residing in suburban areas and 280 (82.1%) reported residing in urban areas with high population densities. Figure 1.5 Local Population Size for Churches Urban 82.1% Suburban 13.5% Rural 2.4% N = 325 Location of NGO Work (Local vs. National) For NGOs, 9 (20.9%) reported residing in suburban areas and 31 (72.1%) reported residing in urban areas. A total of 3 churches (7.0%) were located in rural areas. Figure 1.6 Local Population Size for NGOs Urban 72.1% Suburban 20.9% Rural 7.0% N = 43 Denominational Affiliation: Description of Churches Churches by Denominational Affiliation Of the 334 local churches surveyed, 137 (41.0%) affiliated with being Pentecostal, 71 (21.3%) affiliated with Neo-Pentecostal, 55 (16.5%) affiliated with Historic, 34 (10.2%) affiliated with Independent, 18 (5.4%) affiliated with Apostolic, 15 (4.5%) affiliated with Independent Pentecostal, 3 (.9%) affiliated with Non-Denominational, and 1 (.3%) affiliated with Inter- Denominational. The responses of participating churches are represented in Figure
19 Ministries were asked Is Your Ministry Affiliated With a Denomination? and If Yes, Which One? Figure 1.7 Churches by Denominational Affiliation Pentecostal 41.0% Neo-Pentecostal 21.3% Historic 16.5% Independent 10.2% Apostolic 5.4% Independent Pentecostal Non-Denominational.9% 4.5% N = 334 Inter-Denominational.3% Churches by Recoded Denominational Affiliation Of the 330 local churches surveyed, 137 (41.5%) affiliated with Pentecostal, 71 (21.5%) affiliated with Neo-Pentecostal, 55 (16.7%) affiliated with Historic, 34 (10.3%) affiliated with Independent, and 33 (10.0%) affiliated with Apostolic or Independent Pentecostal. The distributions of the recoded groups are summarized in Figure 1.8. Figure 1.8 Churches by Recoded Denominational Affiliation Pentecostal 41.5% Neo-Pentecostal 21.5% Historic 16.7% Independent Apostolic, Independent Pentecostal 10.3% 10.0% N = 330 Churches by Recoded Denominational Affiliation and by Recoded Geographic Region Figure 1.9 illustrates the relative number of churches representing the five recoded denominational groups within the four recoded geographic regions. There was a significant relationship between geographic region and recoded denomination for number of churches χ 2 (12) = 32.9, p =.001(highly significant), Cramer's V =.183 (strong relationship). 19
20 A greater proportion of churches in the region of Zona Central were from Pentecostal denominations (49.7%) when compared to churches in the region of Norte Chico (24.3%). A greater proportion of churches in the region of Norte Chico were from Historic denomination (30.0%) when compared to churches in the region of Zona Central (10.3%). Figure 1.9 Recoded Denominational Affiliation by Recoded Geographic Region Pentecostal Neo-Pentecostal Apostolic, Independent Pentecostal Independent Historic Norte Chico (N = 70) 24.3% 15.7% 12.9% 17.1% 30.0% Norte Grande (N = 35) 25.7% 22.9% 14.3% 14.3% 22.9% Zona Central (N = 195) 49.7% 23.1% 8.7% 8.2% 10.3% Zona Sur (N = 29) 48.3% 20.7% 6.9% 3.4% 20.7% Attendance: Description of Churches Churches by Attendance Local churches were asked "Approximately how many people attend a service at your church during a normal week?" Of the 341 churches surveyed, 233 (68.3%) of the sample was missing. Of the churches that reported their weekly attendance, 2 (1.9%) reported a weekly attendance of 1 10, 12 (11.1%) reported 11 25, 32 (29.6%) reported 26 50, 34 (31.5%) reported , 16 (14.8%) reported , 7 (6.5%) reported , and 5 (4.6%) reported > 500. The distribution of these groups is represented in Figure Figure 1.10 Local Church Service Attendance % % % > % % % % N =
21 Churches by Recoded Attendance Church attendance was recoded from seven categories to two categories to examine group differences. Categories representing 50 or fewer weekly attendees were combined to form the category Categories representing 51 or more weekly attendees were combined to form the category > 50. The distributions of the recoded groups are summarized in Figure Of the 108 churches that reported their weekly attendance, 46 (42.6%) reported 50 or fewer, and 62 (57.4%) reported > 50. Figure 1.11 Local Church Service by Recoded Church Attendance > % % N = 108 Recoded Church Attendance by Recoded Geographic Region There was no statistically significant relationship between recoded region and church attendance (Figure 1.12). Figure 1.12 Recoded Geographic Region by Recoded Church Attendance 1 50 > 50 Norte Chico (N = 56) Norte Grande (N = 9) Zona Central (N = 35) Zona Sur (N = 8) 42.9% 44.4% 40.0% 50.0% 57.1% 55.6% 60.0% 50.0% Church Interaction With Children Of the 320 churches that reported about interaction with children (ages 5 11), 84 (26.3%) 21
22 reported that interaction increased more than 10.0%, 77 (24.1%) reported an increase of ten 10.0% or less, 126 (39.4%) reported they remained the same, 21 (6.6%) reported a decrease of more than 10.0%, and 12 (3.8%) reported a decrease of 10.0% or less (Figure 1.13). Figure 1.13 Church Interaction With Children Over Past Two Years Increased by More Than 10.0% 26.3% Increased by 10.0% or Less 24.1% Stayed About the Same 39.4% Decreased by 10.0% or Less Decreased by More Than 10.0% 3.8% 6.6% N = 320 Church Interaction with Youth Of the 341 churches sampled, 298 reported about their interaction with youth (ages 12 19) over the past two years. Of the 298 churches, 80 (26.8%) reported an increase of more than 10.0%, 48 (16.1%) reported an increase of 10.0% or less, 128 (43.0%) reported the interaction remained the same, 19 (6.4%) reported a decrease of more than 10.0%, and 23 (7.7%) reported a decrease of 10.0% or less (Figure 1.10B). Figure 1.10B Church Interaction With Youth Over Past 2 Years Increased by More Than 10.0% 26.8% Increased by 10.0% or Less 16.1% Stayed About the Same 43.0% Decreased by 10.0% or Less 7.7% Decreased by More Than 10.0% 6.4% N = 298 Youth in Leadership Roles As shown in Figure 1.11, a majority of churches reported that few youth in their churches hold leadership roles. Of the 326 churches that reported the percent of youth in leadership roles, 54 (16.6%) reported no youth leaders, 146 (44.8%) reported 1 10%, 76 (23.3%) reported 11 25%, 31 (9.5%) reported 26 50%, and 19 (5.8%) reported over 50%. 22
23 Figure 1.11 Percent of Youth in Leadership Roles in Churches None 16.6% % 44.8% % 23.3% % > 50.0% 5.8% 9.5% N = 326 Ministry Focus Church and NGO Age Focus by Ministry Type Ministries were asked Which of these age groups most often participate in your ministry to children and/or youth: Ages 5 11, 12 15, and/or 16 19? Their responses are represented in Figure 2.1. There were no statistically significant relationships between ministry type and the ministry focus on different age groups. Figure 2.1 Age Focus of Child and Youth Ministry Categories are not mutually exclusive. Ministries may identify one or more age groups. 100% 80% 79.5% 80.0% 60% 53.1% 55.6% 53.3% 49.6% Local Churches (N = 341) 40% NGOs (N = 45) 20% 0% Ages 5 11 Ages Ages Church Age Focus by Recoded Geographic Region Figure 2.2 summarizes churches age focus by recoded geographic region. There were no statistically significant relationships between geographic region and ministry focus on different age groups. 23
24 Figure 2.2 Church Age Focus by Recoded Geographic Region Categories are not mutually exclusive. Ministries may identify one or more age groups. Ages 5 11 Ages Ages Norte Chico (N = 73) 60.3% 52.1% 76.7% Norte Grande (N = 35) Zona Central (N = 198) Zona Sur (N = 34) 48.6% 49.0% 49.0% 47.1% 50.0% 74.3% 68.6% 80.8% 82.4% Note: No statistically significant differences between regions for any age group. Age Focus by Market Population Church Age Focus Figure 2.3 summarizes churches age focus by market population. There were no statistically significant relationships between market population and ministry focus on different age groups. Figure 2.3 Local Church Market Population by Age Focus Categories are not mutually exclusive. Ministries may identify one or more age categories. Ages 5 11 Ages Ages Suburban (N = 45) 60.0% 57.8% 82.2% Urban (N = 280) 51.8% 48.2% 78.6% Note: No statistically significant differences between market populations for any age group. The 8 rural churches were excluded from the statistical testing due to low sample size. 24
25 Church Age Focus by Recoded Denominational Affiliation Figure 2.4 illustrates the relationships between recoded denominational affiliations and age focus. There were no statistically significant relationships between recoded denominational affiliation and ministry focus on ages and ages There was a statistically significant relationship between recoded denomination and ministry focus on ages A greater proportion of churches belonging to a Historic denomination reported a focus on ages 5 11 (83.6%) when compared to churches belonging to the Independent denomination (64.7%) and Apostolic, Independent Pentecostal denomination (69.7%). Figure 2.4 Recoded Denominational Affiliation by Age Focus Categories Categories are not mutually exclusive. Ministries may identify one or more age groups. Ages 5 11* Ages Ages Pentecostal 50.4% 56.9% 84.7% Neo-Pentecostal 53.5% 50.7% 74.6% Apostolic, Independent Pentecostal 48.5% 51.5% 69.7% Independent 47.1% 50.0% 64.7% Historic 45.5% 50.9% 83.6% Note: Categories with statistically significant differences have an asterisk (*). 19 χ 2 (4) = 10.0, p =.040(significant), Cramer's V =.174 (strong relationship). 25
26 Church Age Focus by Recoded Attendance The relationships between recoded church attendance and age focus are represented in Figure 2.5. There was no significant relationship between recoded church attendance and ministry focus on ages There were significant relationships between recoded church attendance and ministry focus on ages and A greater proportion of churches that reported weekly attendance of more than 50 also focused on ages (74.2%) when compared to churches with 50 or fewer people attending (37.0%). 20 A greater proportion of churches that reported weekly attendance of more than 50 also focused on ages (61.3%) when compared to churches with 50 or fewer people attending (39.1%). 21 Figure 2.5 Age Focus by Recoded Church Attendance Ages 5 11 Ages 12 15* Ages 16 19* 1 50 (N = 46) 37.0% 39.1% 80.4% > 50 (N = 62) 61.3% 74.2% 87.1% Note: Categories with statistically significant differences have an asterisk (*). Programs (Churches and NGOs) Programs by Ministry Type National Statistics for Church Children Programs The rates of children s programs for local churches appear in descending order in Figure 3.1A. Churches were most likely to conduct Sunday school programs (89.3%) and least likely to conduct orphan care programs (6.2%). 20 χ 2 (1) = 15.1, p <.001(highly significant), Cramer's V =.373 (very strong relationship). 21 χ 2 (1) = 5.2, p =.023(significant), Cramer's V =.219 (strong relationship). 26
27 Figure 3.1A What Types of Programs Does Your Local Church Conduct for Children? Categories are not mutually exclusive. Ministries may identify one or more programs. Sunday School 89.3% Large Evangelistic Gatherings/Festivals 70.4% Person-to-Person Evangelism 66.9% Bible Clubs or Studies 66.7% Scripture Distribution 58.9% Music-Based Events 55.3% Leadership Training/Development 51.5% Camps or Retreats 49.4% Ministry to At-Risk Children and Youth 37.3% Hospital Ministry 22.8% Sports Ministry School-Based Program 17.8% 15.1% N =338 Addiction or Trauma Recovery 14.5% Literacy 8.9% Orphan Care 6.2% National Statistics for Church Youth Programs The rates of youth programs for local churches appear in descending order in Figure 3.1B. Churches were most likely to conduct Sunday school programs (76%) and least likely to conduct orphan care programs (7.8%). 27
28 Figure 3.1B What Types of Programs Does Your Local Church Conduct for Youth? Sunday School 76.0% Bible Clubs or Studies 72.1% Person-to-Person Evangelism 69.7% Large Evangelistic Gatherings/ Festivals 68.8% Scripture Distribution 63.1% Leadership Training 63.1% Camps or Retreats 62.8% Music Based Events 61.0% Ministry to At-Risk Children and Youth 38.4% Hospital Ministry 32.1% Sports Ministry Addiction or Trauma Recovery 21.9% 20.7% N =333 School Based 17.5% Ministry to Youth in Jail or Prison 11.7% Literacy 9.6% Orphan Care 7.8% 28
29 National Statistics for NGO Children Programs The rates of children programs for NGOs appear in descending order in Figure 3.2A. NGOs were most likely to conduct person-to-person evangelism (70.5%), Sunday school programs (63.6%), and scripture distribution (63.6%). NGOs were least likely to conduct hospital-based programs (27.3%), literacy programs (15.9%), and orphan care (9.1%). Figure 3.2A What Types of Programs Does Your NGO Conduct for Children? Categories are not mutually exclusive. Ministries may identify one or more programs. Person-to-Person Evangelism 70.5% Sunday School 63.6% Scripture Distribution 63.6% Bible Clubs or Studies 59.1% Large Evangelistic Gatherings/Festivals 59.1% Leadership Training 56.8% Music Based Events 54.5% Camps or Retreats 47.7% Ministry to At-Risk Children and Youth 43.2% School Based 31.8% Sports Ministry 31.8% Addiction or Trauma Recovery 27.3% Hospital Ministry 27.3% Literacy 15.9% N = 44 Orphan Care 9.1% 29
30 National Statistics for NGO Youth Programs The rates of youth programs for NGOs appear in descending order in Figure 3.2B. NGOs were most likely to conduct person-to-person evangelism (76.3%), scripture distribution (73.7%), and Bible clubs or studies (71.1%). NGOs were least likely to conduct literacy (15.8%), ministry to youth in jail or prison (15.8%), and orphan care programs (13.2%). Figure 3.2B What Types of Programs Does Your NGO Conduct for Youth? Person-to-Person Evangelism Scripture Distribution Bible Clubs or Studies Large Evangelistic Gatherings/Festivals Leadership Training Sunday School Music-Based Events Camps or Retreats Ministry to At-Risk Children and Youth School-Based Programs Sports Ministry Hospital Ministry 76.3% 73.7% 71.1% 63.2% 63.2% 60.5% 57.9% 47.4% 47.4% 36.8% 34.2% 28.9% Addiction or Trauma Recovery Literacy Ministry to Youth in Jail or Prison Orphan Care 21.1% 15.8% 15.8% 13.2% N = 38 Church Programs by Recoded Geographic Region Only 1 of the 15 programs for children ages 5 11 was significant (See Figure 3.3A). There was a statistically significant relationship between recoded geographic regions and literacy programs for children and youth. 22 A greater proportion of churches in the region of Norte Grande reported having a literacy program (22.9%) when compared to churches in the regions of Zona Sur (11.8%) and Norte Chico (2.7%). 22 χ 2 (3) = 12.33, p =.001(significant), Cramer's V =.191 (strong relationship). 30
31 Figure 3.3A Statistically Significant Differences in Children Church Programs by Recoded Geographic Region Categories are not mutually exclusive. Ministries may identify one or more programs. Zona Sur (N = 34) Zona Central (N = 196) Norte Grande (N = 35) Norte Chico (N = 73) 11.8% Literacy 8.2% 22.9% 2.7% Note: Programs shown have statistically significant differences. Only 2 of the 16 programs for youth ages were significantly different across recoded geographic region (See Figure 3.3B). There was a statistically significant relationship between region and scripture distribution programs. 23 A greater proportion of churches in the region of Norte Grande reported a scripture distribution (77.1%) when compared to churches in the region of Zona Central (59.1%) and Zona Sur (58.8%). There was a statistically significant relationship between region and leadership training/development programs. 24 A greater proportion of churches in the region of Norte Grande reported having a leadership training/development program (76.7%) when compared to churches in the region of Zona Central (56.5%). Figure 3.3B Statistically Significant Differences in Youth Church Programs by Recoded Geographic Region Categories are not mutually exclusive. Ministries may identify one or more programs. Zona Sur (N = 34) Zona Central (N = 191) Norte Grande (N = 35) Norte Chico (N = 73) Scripture Distribution 58.8% 56.5% 74.3% 76.7% Leadership Training 83.3% 56.5% 65.7% 76.7% Note: Programs shown have statistically significant differences. 23 χ 2 (3) = 11.48, p =.009(significant), Cramer's V =.186 (strong relationship). 24 χ 2 (3) = 9.74, p =.021(significant), Cramer's V =.171 (strong relationship). 31
32 Church Programs by Attendance Two of the 15 programs for children ages 5 11 showed significant variation across church attendance categories (See Figure 3.4A). There was a significant relationship between church attendance and Sunday school programs and a significant relationship between church attendance and large evangelistic gatherings/festivals. A greater proportion of churches with more than 50 people attending had a Sunday school (96.8%) when compared to churches with 50 or fewer people attending (84.8%). 25 Additionally, a greater proportion of churches with more than 50 people in attendance had large evangelistic gatherings/festivals (82.3%) when compared to churches with 50 or fewer people in attendance (65.2%). 26 Figure 3.4A Statistically Significant Differences for Ages 5 11 in Church Programs by Recoded Church Attendance 1 50 (N = 46) > 50 (N = 62) Sunday School 84.8% 96.8% Large Evangelistic Gatherings/Festivals 65.2% 82.3% Note: Programs shown have statistically significant differences. Only 1 of the14 programs for youth showed significant variation across church attendance (See Figure 3.4B). There was a significant relationship between church attendance and camps or retreats. 27 A greater proportion of churches with more than 50 people in attendance reported a camps or retreats program (80.6%) compared to churches with 50 or fewer people in attendance (54.3%). Figure 3.4B Statistically Significant Differences for Ages in Church Programs by Recoded Church Attendance 1 50 (N = 46) > 50 (N = 62) Camps or Retreats 54.3% 80.6% 25 χ 2 (1) = 4.9, p =.026(significant), Cramer's V =.215 (strong relationship). 26 χ 2 (1) = 4.1, p =.043(significant), Cramer's V =.195 (strong relationship). 27 χ 2 (1) = 8.61, p =.003(highly significant), Cramer's V =.282 (very strong relationship). 32
33 Program Categories Recoded Program Categories Each program for children and youth was assigned to one of five categories: evangelism, discipleship, benevolence, evangelism and discipleship, or evangelism and benevolence.(see Figure 4.1). Figure 4.1 Recoded Program Categories Programs for Children and Youth Person-to-Person Evangelism Scripture Distribution Large Evangelistic Gatherings/Festivals Camps or Retreats Leadership Training/Development Literacy Music Based Events Ministry in Hospitals Orphan Care Sunday School Bible Clubs or Studies Sports Ministry School-Based Programs Ministry to At-Risk Children and Youth Ministry to Youth in Jail or Prison Addiction or Trauma Recovery Categories Evangelism Discipleship Benevolence Evangelism and Discipleship Evangelism and Benevolence Recoded Program Categories by Ministry Type Recoded Church Program Categories The percentages of local churches conducting specific program categories appear in Figure 4.2A. Almost all churches conducted evangelism and/or discipleship programs for ages 5 11 (95.6%). Most churches conducted evangelism programs for ages 5 11 (88.9%) and ages (89.4%). Less than half of the churches conducted evangelism and/or benevolence programs for ages 5 11 (45.2%) and a little more than half for ages (51.0%). 33
34 Figure 4.2A Recoded Program Categories for Children for Local Churches Evangelism/Discipleship Programs for Ages % Evangelism/Discipleship Programs for Ages % Evangelism Programs for Ages % Evangelism Programs for Ages % Benevolence Programs for Ages % Benevolence Programs for Ages % Discipleship Programs for Ages % Discipleship Programs for Ages % Evangelism/Benevolence Programs for Ages Evangelism/Benevolence Programs for Ages % N (Ages 5 11) = % N (Ages 12 19) =
35 The percentages of local churches conducting specific program categories appear in Figure 4.2B. Over all, churches conducted more programs for youth ages than they did for children ages Almost all churches conducted evangelism and/or discipleship programs for ages (91.1%). Most of the churches conducted evangelism programs for ages 5 11 (80.0%) and for ages (86.7%). Figure 4.2B Program Categories for Youth for NGOs Evangelism/Discipleship Programs for Ages % Evangelism Programs for Ages % Evangelism Programs for Ages % Evangelism/Discipleship Programs for Ages % Benevolence Programs for Ages % Discipleship Programs for Ages % Evangelism/Benevolence Programs for Ages % Benevolence Programs for Ages % Evangelism/Benevolence Programs for Ages 5 11 Discipleship Programs for Ages % 56.8% N (Ages 5 11) = 44 N (Ages 12 19) = 38 35
36 Recoded Church Program Categories by Recoded Denominational Affiliation Figure 4.3 illustrates the relationships between recoded church program categories and recoded denominational affiliations. There was a statistically significant relationship between recoded denomination and discipleship program for children ages A greater proportion of churches belonging to an Apostolic, Independent Pentecostal reported a discipleship program (69.7%) when compared to churches belonging to an Independent (44.1%) and Pentecostal (40.4%) denomination. There was also a statistically significant relationship between denomination and evangelism and benevolence program for children ages A greater proportion of churches belonging to a Neo-Pentecostal denomination reported an evangelism and benevolence program (59.4%) when compared to churches belonging to an Independent (29.4%) and Pentecostal (41.9%) denomination. There was also a significant relationship between denomination and discipleship program for youth ages A less proportion of churches belonging to a Pentecostal reported conducting a discipleship program (51.9%) when compared to churches belonging to a Neo Pentecostal (72.1%), an Apostolic, Independent Pentecostal (77.4%), and Historic (69.1%) denomination. Finally, there was a significant relationship between denomination and evangelism and benevolence program for youth ages A greater proportion of churches belonging to a Neo-Pentecostal denomination reported an evangelism and benevolence program (63.2%) compared to churches belonging to a Pentecostal (47.4%) and Independent (32.4%) denomination. 28 χ2 (4) = 16.9, p =.002(highly significant), Cramer's V =.227 (strong relationship). 29 χ2 (4) = 9.8, p =.043(significant), Cramer's V =.174 (strong relationship). 30 χ2 (4) = 13.2, p =.010(significant), Cramer's V =.203 (strong relationship). 31 χ2 (4) = 9.6, p =.049(significant), Cramer's V =.172 (strong relationship). 36
37 Figure 4.3 Recoded Program Categories by Recoded Denominational Affiliation for Churches Pentecostal (N = 136) Neo Pentecostal (N = 69) Apostolic, Independent Pentecostal (N = 33) Independent (N = 34) Historic (N = 55) Evangelism Programs for Ages 5 11 Discipleship Programs for Ages 5 11* Benevolence Programs for Ages 5 11 Evangelism/Discipleship Programs for Ages 5 11 Evangelism/Benevolence Programs for Ages 5 11* Evangelism Programs for Ages Discipleship Programs for Ages 12 19* Benevolence Programs for Ages 12 19* Evangelism/Discipleship Programs for Ages Evangelism/Benevolence Programs for Ages 12 19* 88.2% 95.7% 84.8% 79.4% 90.9% 40.4% 63.8% 69.7% 44.1% 58.2% 64.0% 69.6% 75.8% 50.0% 67.3% 95.6% 95.7% 93.9% 94.1% 98.2% 41.9% 59.4% 42.4% 29.4% 47.3% 84.4% 94.1% 87.1% 79.4% 87.3% 51.9% 72.1% 77.4% 64.7% 69.1% 74.8% 72.1% 77.4% 50.0% 67.3% 85.9% 92.6% 90.3% 91.2% 92.7% 47.4% 63.2% 48.4% 32.4% 52.7% Note: Categories with statistically significant differences have an asterisk (*). 37
38 Recoded Church Program Categories by Recoded Geographic Region There was a significant relationship between recoded geographic region and evangelism programs for youth ages (See Figure 4.4). 32 A greater proportion of churches in the region of Norte Chico reported an evangelism program (97.3%) compared to churches in the region of Zona Central (82.2%) and Zona Sur (79.4%). There was a significant relationship between geographic region and discipleship programs for youth ages A greater proportion of churches in the region of Norte Chico reported a discipleship program (76.7%) compared to churches in the region of Zona Central (56.5%). There was also a significant relationship between geographic region and evangelism and discipleship programs for youth ages A less proportion of churches in the region of Zona Central reported an evangelism and discipleship program (84.8%) compared to churches in Norte Chico (95.9%) and Norte Grande (97.1%). Figure 4.4 Program Categories by Recoded Geographic Region for Churches Norte Chico (N = 73) Norte Grande (N = 35) Zona Central (N = 196) Zona Sur (N = 34) Evangelism Programs for Ages 5 11 Discipleship Programs for Ages 5 11 Benevolence Programs for Ages 5 11 Evangelism/Discipleship Programs for Ages 5 11 Evangelism/Benevolence Programs for Ages 5 11 Evangelism Programs for Ages 12 19* Discipleship Programs for Ages Benevolence Programs for Ages Evangelism/Discipleship Programs for Ages 12 19* Evangelism/Benevolence Programs for Ages % 91.4% 85.7% 88.2% 52.1% 65.7% 49.0% 50.0% 56.2% 74.3% 64.8% 76.5% 97.3% 100.0% 93.9% 97.1% 49.3% 57.1% 41.8% 38.2% 97.3% 94.3% 82.2% 79.4% 76.7% 65.7% 56.5% 67.6% 67.1% 80.0% 68.6% 76.5% 95.9% 97.1% 84.8% 91.2% 54.8% 57.1% 48.7% 38.2% 32 χ 2 (3) = 13.5, p =.004(highly significant), Cramer's V =.202 (strong relationship). 33 χ 2 (3) = 9.7, p =.021(significant), Cramer's V =.171 (strong relationship). 34 χ 2 (3) = 9.6, p =.022(significant), Cramer's V =.170 (strong relationship). 38
39 Note: Categories with statistically significant differences have an asterisk (*). Categories of Recoded Church Programs by Market Population The relationships between recoded church program categories and market population are represented in Figure 4.5. There were no statistically significant relationships between recoded church programs and market population. Figure 4.5 Recoded Program Categories by Market Population for Churches Suburban (N = 45) Urban (N = 277) Evangelism Programs for Ages % 88.4% Discipleship Programs for Ages 5 11 Benevolence Programs for Ages % 53.1% 64.4% 65.7% Evangelism/Discipleship Programs for Ages % 96.4% Evangelism/Benevolence Programs for Ages % 44.8% Evangelism Programs for Ages % 86.4% Discipleship Programs for Ages Benevolence Programs for Ages % 64.5% 71.1% 70.0% Evangelism/Discipleship Programs for Ages % 90.5% Evangelism/Benevolence Programs for Ages % 50.9% Recoded Church Program Categories by Recoded Church Attendance Figure 4.6 displays the relationships between recoded church program categories and recoded church attendance. There was a statistically significant relationship between recoded church 39
40 attendance and evangelism and benevolence programs for children ages A greater proportion of churches that had more than 50 people in attendance reported an evangelism and benevolence program (56.5%) when compared to churches with 50 or fewer people in attendance (34.8%). Figure 4.6 Program Categories for Children and Youth by Recoded Church Attendance 1 50 (N = 46) > 50 (N = 62) Evangelism Programs for Ages % 95.2% Discipleship Programs for Ages % 46.8% Benevolence Programs for Ages % 69.4% Evangelism/Discipleship Programs for Ages % 100.0% Evangelism/Benevolence Programs for Ages 5 11* 34.8% 56.5% Evangelism Programs for Ages % 88.7% Discipleship Programs for Ages % 59.7% Benevolence Programs for Ages % 71.0% Evangelism/Discipleship Programs for Ages % 91.9% Evangelism/Benevolence Programs for Ages % 59.7% Note: Programs with statistically significant differences have an asterisk (*). 35 χ 2 (1) = 5.0, p =.026(significant), Cramer's V =.215 (strong relationship). 40
41 Technology Frequency of Technology Use by Churches The frequency of technology use by churches appears in Figure 5.1. Churches were most likely to use social media (56.7%) and video (54.3%). Churches rarely used websites (42.4%). Figure 5.1 How Often Are the Following Technologies Used for the Ministry? Never Sometimes Often We Plan to Begin in the Next Year Texting (N = 336) (N = 337) Social Media (N = 337) Website (N = 337) Video (N = 337) 32.1% 29.1% 23.4% 42.4% 18.4% 24.7% 22.8% 17.5% 20.2% 25.2% 41.7% 46.0% 56.7% 33.2% 54.3% 1.5% 2.1% 2.4% 4.2% 2.1% Frequency of Technology Use by Ages in Churches The frequency of technology use by ages appears in Figure 5.2. Youth from ages were most likely to use cell phones (57.9%) and video equipment (54.2%). However, they were also the least likely to use smart phones (33.1%). Figure 5.2 How Many Children and Youth (Ages 12 19) Use the Following Technologies? None About 25.0% About 50.0% About 75.0% All Cellphones (N = 335) 3.3% 6.9% 10.1% 21.8% 57.9% Smartphones (N = 335) 33.1% 20.6% 13.4% 20.9% 11.9% Internet (N = 335) 4.5% 11.3% 15.5% 23.9% 44.8% Video Equipment (N = 334) 5.1% 5.4% 12.0% 23.4% 54.2% 41
42 Secondary Impact Secondary Impact by Ministry Type Church Programs That May Impact Children and Youth Ministries were asked "What types of programs or activities does your ministry conduct that may impact children and youth?" In Figure 6.1, the percentages of specific programs conducted by churches appear in descending order. Churches were most likely to conduct food programs (56.5%) and least likely to conduct water or sanitation programs (7.1%). Figure 6.1 What Types of Programs Does Your Local Church Conduct That May Impact Children and Youth? Categories are not mutually exclusive. Ministries may identify one or more programs. Food Programs 56.5% Health Programs 18.2% Life-Skills Training 13.5% Micro Finance Programs 13.2% N = 325 Water or Sanitation Programs 7.1% NGO Programs That May Impact Children and Youth In Figure 6.2, the percentages of specific programs conducted by NGOs appear in descending order. NGOs were most likely to conduct food programs (52.5%) and health programs (46.3%) and were least likely to conduct micro-finance programs (19.5%) and water or sanitation programs (14.6%). Figure 6.2 What Types of Programs Does Your NGO Conduct That May Impact Children and Youth? Categories are not mutually exclusive. Ministries may identify one or more programs. Food Programs Health Programs 46.3% 52.5% Life-Skills Training 29.3% Micro Finance Programs Water or Sanitation Programs 14.6% 19.5% N = 41 42
43 Local Church Programs That May Impact Children and Youth by Market Population Size The relationships between church programs that may impact children and youth and market population size are displayed in Figure 6.3. One of the five programs that may impact children and youth was significantly different across market population sizes. 36 There was a significant relationship between market population size and food programs. A greater proportion of churches in suburban areas reported having a food program (74.4%) when compared to churches in urban areas (55.6%). Figure 6.3 Local Church Programs That May Impact Children and Youth by Market Population Size Categories are not mutually exclusive. Ministries may identify one or more programs. Urban (N = 267) Suburban (N = 43) Micro Finance Programs 13.9% 14.0% Life-Skills Training 9.3% 15.0% Health Programs 14.0% 19.9% Water or Sanitation Programs 2.3% 8.2% Food Programs* 55.4% 74.4% Note: Programs with statistically significant differences have an asterisk (*). Local Church Programs That May Impact Children and Youth by Recoded Geographic Region The relationships between church programs that may impact children and youth and market population size are displayed in Figure 6.4. One of the five programs that may impact children and youth were significantly different across regions. There was a significant relationship between region and food program. 37 A greater proportion of churches in the region of Zona Sur reported having a food program (75.8%) compared to churches in the region of Norte Chico (45.8%) and Norte Grande (56.7%). 36 χ 2 (1) = 5.4, p =.021(significant), Cramer's V =.132 (moderate relationship). 37 χ 2 (3) = 8.3, p =.039(highly significant), Cramer's V =.160 (strong relationship). 43
44 Figure 6.4 Local Church Programs That May Impact Children and Youth by Recoded Geographic Region Zona Sur (N = 33) Zona Central (N = 189) Norte Grande (N = 31) Norte Chico (N = 72) Micro Finance Programs 21.2% 14.8% 9.7% 8.3% Life-Skills Training 12.1% 13.2% 11.1% 22.6% Health Programs 12.1% 16.9% 25.8% 20.8% Water or Sanitation Programs 3.0% 7.9% 6.5% 6.9% Food Programs* 45.8% 57.1% 54.8% 75.8% Note: Programs with statistically significant differences have an asterisk (*). There were no statistically significant relationships between types of programs and recoded denomination (Figure 6.5). 44
45 Figure 6.5 Local Church Programs That May Impact Children and Youth by Recoded Denominational Affiliations Historic (N = 51) Independent (N = 33) Apostolic, Independent Pentecostal (N = 32) Neo Pentecostal (N = 64) Pentecostal (N = 135) Micro Finance Programs 13.7% 9.1% 18.8% 21.9% 10.4% Life-Skills Training 9.8% 6.1% 15.6% 17.2% 15.6% Health Programs 9.1% 21.6% 18.8% 23.4% 17.0% Water or Sanitation Programs 9.8%.0% 6.3% 4.7% 9.6% Food Programs 47.1% 51.5% 56.3% 57.0% 67.2% Note: Programs with statistically significant differences have an asterisk (*). 45
46 Reach Reported Direct and Indirect Impact for Churches and NGOs Reported Impact or Engagement is a respondent s indicated annual engagement with children and youth aged How many children and youth does a ministry impact annually? Of the ministries surveyed, 300 of the 341 churches and 36 of the 45 NGOs responded to the question "Approximately how many children (ages 5 11) and youth (ages 12 19) does your ministry impact each year?" On average, local churches reported reaching approximately 23 children (SD = 90) and 16 youth (SD = 26) each year. NGOs reported reaching an average of 99 (SD = 259) children and 40 (SD = 91) youth each year. Reports varied widely from a minimum of 1 to a maximum of 1,540 children and youth reached per ministry. Half of the local churches "numbers reached" were above 22 and half were below, representing the median. For NGOs, the median value was 31. The data calculating ministries reaches are summarized in Figures 7.1 (annual direct reach for churches) and 7.2 (annual direct reach for NGOs) for younger children (5 11) and older children (12 19) separately. Churches: o Ages 5 11: 6,983 o Ages 12 19: 4,598 o Total 38 : 11,361 NGOs: o Ages 5 11: 3,574 o Ages 12 19: 1,364 o Total 39 : 3,880 Total: o Ages 5 11: 10,557 o Ages 12 19: 5,962 o Total 40 : 15,241 Calculating Annual Direct Gospel Reach for Churches and NGOs Gospel Reach After being asked about the number of children and youth that the ministry engages or interacts with, they were asked, Of those children (ages 5 11) and/or youth (ages 12 19) numbered in previous question, to approximately how many does your ministry present the Gospel of salvation through Jesus Christ? Enter the actual number or your best estimate. Count each individual only once. After adjustment for Gospel content, the average number of children reached by local churches remained at 23 (SD = 93), and the average number of youth remained about the same at 15 (SD = 25). The average number of children reached by NGOs decreased to 90 (SD = 257), and youth reached reduced slightly to 36 (SD = 94). Median values were 22 for local churches and 31 for NGOs. 38 The totals do not equal the sum of the older and younger children because some organizations only answered the total but did not provide any information about the breakdown between older and younger children. 39 Same as note Same as note
47 Direct vs. Indirect Reach After being asked about Gospel Reach, they were asked about the number of children with whom they have direct personal interaction. Specifically, churches were asked, Of those children (ages 5 11) and/or youth (ages 12 19) numbered in the previous question, how many are presented with the Gospel in a direct personal interaction where the child or youth can respond or ask questions or pray with the presenter or a ministry representative? After adjustment for indirect reach, the average number of children reached by local churches was 22 (SD = 95), and the average youth reached was 14 (SD = 25). The average number of children reached increased to 95 (SD = 265), and youth reached by NGOs remained the same at 36 (SD = 92). Median values were 20 for local churches and 30 for NGOs. The increase in average children reached by NGOs indicates a possible misunderstanding of the initial engagement with children in question. Additionally, several NGOs who answered the initial reach question did not answer this question, which may have affected the reach mean. Length of Ministry Engagement Responses to another survey question were used to further adjust the number of children and youth reached based on the average length of time the ministry works with them. The survey asked, "Approximately how long does your ministry work with each individual child or youth, on average?" with response options of "Less than a year," "1 year but less than 2 years," "2 years but less than 3 years," or "3 years or more." Where the ministry indicated "3 years or more," its numbers reached were reduced to one-third of the previously adjusted counts; if the ministry indicated "2 years but less than 3 years," its numbers reached were reduced to one-half of the previously adjusted counts. This adjustment seeks to reduce duplicated counting where ministries work with the same children for multiple years. This question was asked separately for children (5 11 years) and youth (12 19 years). For local churches, the average number of children reached was 10 (SD = 34), and the average number of youth reached was 8 (SD = 17). For NGOs, the average number of children reached was 73 (SD = 261), and the average number of youth reached was 29 (SD = 93). NGO Ministry Through Churches Finally, NGOs were also asked what proportion of their ministry to children and youth occurred through local churches. The answer options included none, a small amount, about half, the majority, and all. If the NGO indicated that all of their reach occurred through local churches, then their total was adjusted to 0. If they said the majority occurred through local churches, their total was adjusted down to 25% of the previous total. If they said about half, then their reach was cut in half. If they said a small amount occurred through local churches, then 75% of their reach was kept. Finally, if none of their reach occurred through local churches, their total was not adjusted. This was done to account for overlap between the reported reach of the local churches and the NGOs. After adjustments, the average number of children reached was 30 (SD = 67), and the average number of youth reached was 15 (SD = 24). 47
48 Figures 7.1 and 7.2 show the annual reach for churches and NGOs. Figure 7.1 Calculating Annual Direct Gospel Reach for Churches Annual Engagement Number Gospel Presented to Engaged Gospel Directly Presented to Engaged Length of Ministry Engagement Child (5 11 Years) Youth (12 19 Years) N Valid Missing Mean Median Mode Std. Deviation Minimum Maximum 1,500 1,500 1, Sum 6,983 6,520 6,006 2,693 N Valid Missing Mean Median Mode Std. Deviation Minimum Maximum Sum 4,598 4,222 3,777 2,059 48
49 Figure 7.2 Calculating Annual Direct Gospel Reach for NGOs Child (5 11 Years) Youth (12 19 Years) N Annual Engagement Number Gospel Presented to Engaged Gospel Directly Presented to Engaged Length of Ministry Engagement Adjusted by Amount of Ministry Through Churches Valid Missing Mean Median Mode Std. Deviation Minimum Maximum 1,500 1,500 1,500 1, Sum 3,574 3,159 3,124 2, N Valid Missing Mean Median Mode a 0 Std. Deviation Minimum Maximum Sum 1,364 1,151 1, Annual Direct Gospel Reach for Churches and NGOs Churches: o Ages 5 11: 2,693 o Ages 12 19: 2,059 o Total: 4,751 NGOs: o Ages 5 11: 986 o Ages 12 19: 492 o Total: 1,478 Total: o Ages 5 11: 3,679 o Ages 12 19: 2,251 o Total: 6,230 49
50 Annual Church Reach by Geographic Region Figures 7.3 through 7.6 show the breakdowns of annual reach by region, denomination, and attendance for churches. Both the total annual reach and the average annual reach per church are shown. Specifically, the total reach shows how the reach was broken down based on the specific sample for this project. Regional areas and denominations that made up more of the sample showed more reach. The average annual reach, in contrast, presents the average reach of all the churches in that region, denomination, or church size to facilitate making comparisons between groups. Annual Church Reach by Geographic Region Figure 7.3 Total Annual Church Reach by Geographic Region 5 to to 19 Zona Sur (N = 23) Zona Central (N = 155) 1,374 1,868 Northe Grande (N = 21) Northe Chico (N = 67) Figure 7.4 Average Annual Church Reach by Geographic Region 5 to to 19 Zona Sur (N = 23) Zona Central (N = 155) Northe Grande (N = 21) Northe Chico (N = 67)
51 Annual Church Reach by Denominational Affiliation Figure 7.5 Total Annual Church Reach by Denominational Affiliation 5 to to 19 Pentecostal (N = 113) Neo Pentecostal (N = 55) Apostolic, Independent Pentecostal (N = 26) Independent (N = 28) Historic (N = 38) Figure 7.6 Average Annual Church Reach by Denominational Affiliation 5 to to 19 Pentecostal (N = 113) Neo Pentecostal (N = 55) Apostolic, Independent Pentecostal (N = 26) Independent (N = 28) Historic (N = 38)
52 Annual Church Reach by Attendance Figure 7.7 Total Annual Church Reach by Attendance 5 to to or Fewer (N = 37) More than 50 (N = 56) Figure 7.8 Average Annual Church Reach by Attendance 5 to to or Fewer (N = 37) More than 50 (N = 56) Calculated National Reach for Churches and NGOs Calculated National Reach 41 was arrived at by multiplying median church Reach (10) by the number of Protestant and Evangelical churches reported by Operation World (21,648) and adding that total (216,480) to total NGO Annual Direct Gospel Reach (1,478) for a final 217,958. Churches median (10) x protestant churches in Ecuador (21,648) = churches total (216,480) NGOs sum (1,478) + churches total (216,480) = national total (217,958) 41 Reach calculations should be considered as preliminary and are subject to further adjustment based on such factors as incorporating actual mega-church reach and further clarification from participating ministries. 52
53 LIMITATIONS There is potential overlap in the Reach estimate for NGOs and churches, which would tend to inflate the national Reach estimate. Churches and NGOs may reach the same children and youth, either incidentally, or by intentionally working in direct partnership. This would be especially common in countries with a large Christian population, like Chile. The churches external Reach data were adjusted down based on several factors related to OneHope s internal missional Reach definition (see Methods section). In Chile, all the churches and NGOs surveyed were located in urban or suburban areas. As a result, ministry activity in rural areas is not represented in this study. 53
54 ACKNOWLEDGEMENTS Chile Project Team Daniella González OneHope Research Coordinator, Chile, served as National Project Coordinator and led the in-country effort for this project. Soledad Rozas, Onehope Ministerial Coordinator for Latin America, served as Advisor and facilitator. Josh Parker, OneHope International Project Coordinators, led from the home office. Special thanks for cooperation, input, and expertise: Ricardo Luna, OneHope Regional Director, Latin America. Analysis and Content Team Jacquelyn Pennings, Ph.D., Pstat, Director of Non-Profit Research, and an accredited professional statistician for Elite Research, LLC, assisted with survey development and data analysis. Kathleen Coenen, M.S.W, independent contractor, assisted with data analysis. Christine Schaeffer, M.B.A., Research Consultant, assisted with report preparation. Ceri Usmar, Editor, assisted with report editing. Advisory Feedback and Survey Development Panel Tena Stone, PhD, Director of Research and Training, OneHope, managed the advisory feedback process and contributed to survey development. Patricia McClung, Ed,D., Professor of Early Childhood, Elementary and Special Education, Lee University, wrote the Asset Mapping Literature Review and contributed to survey development. For Contributions to Survey Development: Anne-Christine Bataillard, Lausanne Senior Associate for Children, President of Grain of Wheat Int l Mike Iosia, Ph.D., CSCS, Associate Professor of Exercise Physiology, Lee University, Cleveland, TN Miles Kirby, M.S., Research Assistant, London School of Hygiene and Tropical Medicine Kevin E Lawson, Professor of Christian Education, Director, Ph.D and Ed.D. programs in Educational Studies Richard Luna, Regional Director for Latin America, OneHope Kimberly McKay, M.Ed., Research Project Manager, OneHope Chris Odell, M.P.P, independent consultant: Research and Evaluation Design. 54
55 Colin Piper, Chairman, World Evangelical Alliance Youth Commission Menchit Wong, International Advocacy Director for Compassion International Global Study of Ministry to Children and Youth Oversight Chad Causey, Vice President for Global Ministry, OneHope Tyler Prieb, Director for International Partnership, OneHope Christopher Bedzyk, Project Portfolio Manager, Finished Consulting Services, LLC Dave Plate, M.P.H, Research and Evaluation Coordinator, OneHope. 55
56 APPENDIX A OneHope s Definition of Missional Reach For ministry Reach to be considered missional it must meet the following criteria: Redemptive story of Christ with tested cognitive increase (at design stage) Designed for ages 5 19 Outcome designed and evaluated Plus four of the following six: Opportunity for life transformation (salvation plan) Presentation of life transformation (testimony) Opportunity for integration into community Ongoing engagement through incremental activities Including one of the following: Printed product with: o 1,000 words of Scripture for lower primary o 2,000 words of Scripture for upper primary o 3,000 words of Scripture for teens Robust Scripture content 56
57 APPENDIX B Chile Asset Mapping Survey 57
58 58
59 59
60 60

61 61
62 62
63 63
Executive Summary... 3 Research Design... 3 Summary of Results... 3 Introduction... 6 Purpose... 6 Objectives... 6 Colombia Background Information...
 C2/20%,$ Executive Summary... 3 Research Design... 3 Summary of Results... 3 Introduction... 6 Purpose... 6 Objectives... 6 Colombia Background Information... 7 Project Components... 8 Definitions... 8
Contents. A Letter to Church and Parachurch Ministry Leaders 1. Are We Connecting with the Next Generation? 2. What We Learned 3. Connection Points 4
 GEORGIA Contents A Letter to Church and Parachurch Ministry Leaders 1 Are We Connecting with the Next Generation? 2 What We Learned 3 Connection Points 4 5 6 7 8 How Ministries Are Connecting with Young
and Voting for Evangelicals in Latin America Appendix
 Skeletons Under the Altar: Authoritarian Stereotypes and Voting for Evangelicals in Latin America Appendix Taylor C. Boas, Boston University April 10, 2015 1 Representativeness In Chile, the online sample
Building Up the Body of Christ: Parish Planning in the Archdiocese of Baltimore
 Building Up the Body of Christ: Parish Planning in the Archdiocese of Baltimore And he gave some as apostles, others as prophets, others as evangelists, others as pastors and teachers, to equip the holy
Contents. A Letter to Church and Parachurch Ministry Leaders 1. Are We Connecting with the Next Generation? 2. What We Learned 3. Connection Points 4
 TAIWAN Contents A Letter to Church and Parachurch Ministry Leaders 1 Are We Connecting with the Next Generation? 2 What We Learned 3 Connection Points 4 5 6 7 Parachurch Organizations 8 How Ministries
Christians Say They Do Best At Relationships, Worst In Bible Knowledge
 June 14, 2005 Christians Say They Do Best At Relationships, Worst In Bible Knowledge (Ventura, CA) - Nine out of ten adults contend that their faith is very important in their life, and three out of every
January Parish Life Survey. Saint Paul Parish Macomb, Illinois
 January 2018 Parish Life Survey Saint Paul Parish Macomb, Illinois Center for Applied Research in the Apostolate Georgetown University Washington, DC Parish Life Survey Saint Paul Parish Macomb, Illinois
August Parish Life Survey. Saint Benedict Parish Johnstown, Pennsylvania
 August 2018 Parish Life Survey Saint Benedict Parish Johnstown, Pennsylvania Center for Applied Research in the Apostolate Georgetown University Washington, DC Parish Life Survey Saint Benedict Parish
Appendix 1. Towers Watson Report. UMC Call to Action Vital Congregations Research Project Findings Report for Steering Team
 Appendix 1 1 Towers Watson Report UMC Call to Action Vital Congregations Research Project Findings Report for Steering Team CALL TO ACTION, page 45 of 248 UMC Call to Action: Vital Congregations Research
Pray, Equip, Share Jesus:
 Pray, Equip, Share Jesus: 2015 Canadian Church Planting Survey Research performed by LifeWay Research 1 Preface Issachar. It s one of the lesser known names in the scriptures. Of specific interest for
Summer Revised Fall 2012 & 2013 (Revisions in italics)
") Long Range Plan Summer 2011 Revised Fall 2012 & 2013 (Revisions in italics) St. Raphael the Archangel Parish is a diverse community of Catholic believers called by baptism to share in the Christian mission
Long Range Plan Summer 2011 Revised Fall 2012 & 2013 (Revisions in italics) St. Raphael the Archangel Parish is a diverse community of Catholic believers called by baptism to share in the Christian mission
The Lumiere Project: Church Planting in Francophone Africa. Evaluation Manual
 The Lumiere Project: Church Planting in Francophone Africa Evaluation Manual August 2015 1 1 Updated April 2018 INTRODUCTION Description of the Program and/or Product The GodMan (TGM) is an animated film
Mind the Gap: measuring religiosity in Ireland
 Mind the Gap: measuring religiosity in Ireland At Census 2002, just over 88% of people in the Republic of Ireland declared themselves to be Catholic when asked their religion. This was a slight decrease
Contents. A Letter to Church and Parachurch Ministry Leaders 1. Are We Connecting with the Next Generation? 2. What We Learned 3. Connection Points 4
 UKRAINE Contents A Letter to Church and Parachurch Ministry Leaders 1 Are We Connecting with the Next Generation? 2 What We Learned 3 Connection Points 4 Small Churches 5 Medium Churches 6 Large Churches
Nigerian University Students Attitudes toward Pentecostalism: Pilot Study Report NPCRC Technical Report #N1102
 Nigerian University Students Attitudes toward Pentecostalism: Pilot Study Report NPCRC Technical Report #N1102 Dr. K. A. Korb and S. K Kumswa 30 April 2011 1 Executive Summary The overall purpose of this
Does your church know its neighbours?
 Does your church know its neighbours? A Community Opportunity Scan will help a church experience God at work in the community and discover how it might join Him. Is your church involved in loving its neighbours?
Support, Experience and Intentionality:
 Support, Experience and Intentionality: 2015-16 Australian Church Planting Study Submitted to: Geneva Push Research performed by LifeWay Research 1 Preface Issachar. It s one of the lesser known names
Contents. A Letter to Church and Parachurch Ministry Leaders 1. Are We Connecting with the Next Generation? 2. What We Learned 3. Connection Points 4
 ARGENTINA Contents A Letter to Church and Parachurch Ministry Leaders 1 Are We Connecting with the Next Generation? 2 What We Learned 3 Connection Points 4 5 6 7 8 How Ministries Are Connecting with Young
4D E F 58.07
 A Statistical Overview of the Grand Canyon Synod With comparisons to Rocky Mountain, Northern Texas Northern Louisiana, Southwestern Texas, and Texas Louisiana Gulf Coast Synods Research and Evaluation,
Pastor Views on Technology. Survey of Protestant Pastors
 Pastor Views on Technology Survey of Protestant Pastors 2 Methodology The phone survey of 1,000 Protestant pastors was conducted August 30 September 18, 2017 The calling list was a stratified random sample,
Executive Summary December 2015
 Executive Summary December 2015 This review was established by BU Council at its meeting in March 2015. The key brief was to establish a small team that would consult as widely as possible on all aspects
GRAND CANYON SYNOD PROFILE 2018
 GRAND CANYON SYNOD PROFILE 2018 Synod Territory The State of Arizona, Southern Nevada, and St. George, Utah 153,781 Square Miles Pahrump, NV, to Sierra Vista, AZ = 538 miles 89 Congregations 44,554 Baptized
Appendix. One of the most important tests of the value of a survey is the sniff
 Appendix Transformational Church Research Methodology One of the most important tests of the value of a survey is the sniff test. We all learned this test from our mothers. Mothers have a highly developed
May Parish Life Survey. St. Mary of the Knobs Floyds Knobs, Indiana
 May 2013 Parish Life Survey St. Mary of the Knobs Floyds Knobs, Indiana Center for Applied Research in the Apostolate Georgetown University Washington, DC Parish Life Survey St. Mary of the Knobs Floyds
April Parish Life Survey. Saint Elizabeth Ann Seton Parish Las Vegas, Nevada
 April 2017 Parish Life Survey Saint Elizabeth Ann Seton Parish Las Vegas, Nevada Center for Applied Research in the Apostolate Georgetown University Washington, DC Parish Life Survey Saint Elizabeth Ann
NCLS Occasional Paper Church Attendance Estimates
 NCLS Occasional Paper 3 2001 Church Attendance Estimates John Bellamy and Keith Castle February 2004 2001 Church Attendance Estimates John Bellamy and Keith Castle February 2004 Introduction The National
Center for Applied Research in the Apostolate
 Special Report: Parish Life Today About CARA CARA is a national, non-profit, Georgetown University affiliated research center that conducts social scientific studies about the Catholic Church. Founded
Protestant Pastors Views on the Environment. Survey of 1,000 Protestant Pastors
 Protestant Pastors Views on the Environment Survey of 1,000 Protestant Pastors 2 Methodology The telephone survey of Protestant pastors was conducted in September 26 October 3, 2012 The calling list was
FACTS About Non-Seminary-Trained Pastors Marjorie H. Royle, Ph.D. Clay Pots Research April, 2011
 FACTS About Non-Seminary-Trained Pastors Marjorie H. Royle, Ph.D. Clay Pots Research April, 2011 This report is one of a series summarizing the findings of two major interdenominational and interfaith
Evangelical Lutheran Church in Canada Congregational Mission Profile
 Evangelical Lutheran Church in Canada Congregational Mission Profile Part I Congregation Information 1. Congregation Congregation ID Number: Date Submitted: Congregation Name: Address: City: Postal Code:
Church Leader Survey. Source of Data
 Hope Channel Church Leader Survey Center for Creative Ministry June 2014 Source of Data An Email request was sent to the officers of fthe union conferences and union missions, and the members of the General
THE SEVENTH-DAY ADVENTIST CHURCH AN ANALYSIS OF STRENGTHS, WEAKNESSES, OPPORTUNITIES, AND THREATS (SWOT) Roger L. Dudley
 Roger L. Dudley") THE SEVENTH-DAY ADVENTIST CHURCH AN ANALYSIS OF STRENGTHS, WEAKNESSES, OPPORTUNITIES, AND THREATS (SWOT) Roger L. Dudley The Strategic Planning Committee of the General Conference of Seventh-day Adventists
THE SEVENTH-DAY ADVENTIST CHURCH AN ANALYSIS OF STRENGTHS, WEAKNESSES, OPPORTUNITIES, AND THREATS (SWOT) Roger L. Dudley The Strategic Planning Committee of the General Conference of Seventh-day Adventists
Summary of Research about Denominational Structure in the North American Division of the Seventh-day Adventist Church
 Summary of Research about Denominational Structure in the North American Division of the Seventh-day Adventist Church Surveys and Studies Completed in 1995 by the NAD Office of Information & Research By
NW Lower Michigan 33,820. NW Wisconsin 21,627. EC Wisconsin 13,403
 Northern Great Lakes Synod Ministry Review Quantitative Report John Hessian Research and Evaluation Office of the Presiding Bishop Evangelical Lutheran Church in America March 2017 The Northern Great Lakes
REQUIRED DOCUMENT FROM HIRING UNIT
 Terms of reference GENERAL INFORMATION Title: Consultant for Writing on the Proposal of Zakat Trust Fund (International Consultant) Project Name: Social and Islamic Finance Reports to: Deputy Country Director,
Taiwan Church Growth Report Prepared for the 150 th Anniversary of Protestant Missionaries Coming to the Island
 Taiwan Church Growth Report 2015 Prepared for the 150 th Anniversary of Protestant Missionaries Coming to the Island 1 Contents Executive Summary... 4 Infographic 1: Celebrating 150 Years of Protestant
THE SEVENTH-DAY ADVENTIST CHURCH AN ANALYSIS OF STRENGTHS, WEAKNESSES, OPPORTUNITIES, AND THREATS (SWOT) Roger L. Dudley
 Roger L. Dudley") THE SEVENTH-DAY ADVENTIST CHURCH AN ANALYSIS OF STRENGTHS, WEAKNESSES, OPPORTUNITIES, AND THREATS (SWOT) Roger L. Dudley The Strategic Planning Commission of the General Conference of Seventh-day Adventists
THE SEVENTH-DAY ADVENTIST CHURCH AN ANALYSIS OF STRENGTHS, WEAKNESSES, OPPORTUNITIES, AND THREATS (SWOT) Roger L. Dudley The Strategic Planning Commission of the General Conference of Seventh-day Adventists
Research and Evaluation, Office of the Presiding Bishop Evangelical Lutheran Church in America December 2017
 A Statistical Overview of the Southeastern Pennsylvania Synod With comparisons to Northeastern Ohio (6E), Southern Ohio (6F), Northeastern Pennsylvania (7E), and Lower Susquehanna Synod (8D) Research and
This report is organized in four sections. The first section discusses the sample design. The next
 2 This report is organized in four sections. The first section discusses the sample design. The next section describes data collection and fielding. The final two sections address weighting procedures
Holy Family Catholic Church Key Findings Report
 Holy Family Catholic Church Key Findings Report Toward a Strategic Plan INTRODUCTION 1 I. PARISH VISION AND ORGANIZATION FOR MISSION 3 A. TOWARD A VISION STATEMENT 3 B. PASTORAL STAFF 13 C. LAY LEADERSHIP,
Demographic Survey Taskbook
 Demographic Survey Taskbook Target Location - Rev. David E. Gundrum, Director PO Box 753, Whitehall, PA 18052 Phone: 610-769-4337 fax: 610-769-4338 E-mail: office@churchplantingbfc.org Website: www.churchplantingbfc.org
Compassion, Peace and Justice The August 2010 Survey
 Compassion, Peace and Justice The August 2010 Survey Table of Contents OVERVIEW... i HIGHLIGHTS... iii IMPORTANCE OF THE MINISTRIES WORK... 1 Importance of Types of Mission... 1 Compassion, Peace and Justice
The numbers of single adults practising Christian worship
 The numbers of single adults practising Christian worship The results of a YouGov Survey of GB adults All figures are from YouGov Plc. Total sample size was 7,212 GB 16+ adults. Fieldwork was undertaken
America s Changing Religious Landscape
 Religion & Public Life America s Changing Religious Landscape Christians Decline Sharply as Share of Population; Unaffiliated and Other Faiths Continue to Grow The Christian share of the U.S. population
ABOUT THE STUDY Study Goals
 ABOUT THE STUDY ABOUT THE STUDY 2014 Study Goals 1. Provide a database to inform policy and planning decisions in the St. Louis Jewish community. 2. Estimate the number of Jewish persons and Jewish households
Men practising Christian worship
 Men practising Christian worship The results of a YouGov Survey of GB adults All figures are from YouGov Plc. Total sample size was 7,212 GB 16+ adults. Fieldwork was undertaken between 23rd - 26th September
surveying a church s attitude toward and interaction with islam
 3 surveying a church s attitude toward and interaction with islam David Gortner Virginia Theological Seminary invited our alumni, as well as other lay and ordained church leaders affiliated with the seminary,
Transformation 2.0: Baseline Survey Summary Report
 Transformation 2.0: Baseline Survey Summary Report Authorized by: The Presbytery of Cincinnati Congregational Development Task Force Conducted and Produced by The Missional Network 2 TABLE OF CONTENTS
COMPASSIONATE SERVICE, INTELLIGENT FAITH AND GODLY WORSHIP
 COMPASSIONATE SERVICE, INTELLIGENT FAITH AND GODLY WORSHIP OUR VISION An Anglican community committed to proclaiming and embodying Jesus Christ through compassionate service, intelligent faith and Godly
NCLS Occasional Paper 8. Inflow and Outflow Between Denominations: 1991 to 2001
 NCLS Occasional Paper 8 Inflow and Outflow Between Denominations: 1991 to 2001 Sam Sterland, Ruth Powell and Keith Castle March 2006 The National Church Life Survey The National Church Life Survey has
Views on Ethnicity and the Church. From Surveys of Protestant Pastors and Adult Americans
 Views on Ethnicity and the Church From Surveys of Protestant Pastors and Adult Americans Protestant Pastors Views on Ethnicity and the Church Survey of 1,007 Protestant Pastors 3 Methodology The telephone
2015 SURVEY of NORTH AMERICA'S LARGEST CHURCHES
 Worship 2015 SURVEY of NORTH AMERICA'S LARGEST CHURCHES Please estimate the average attendance at all total regular weekend worship services (Friday, Saturday and Sunday) for the last several years. If
EVANGELISMO A FONDO ESPAÑA MISSIOLÓGICAL RESEARCH
 EVANGELISMO A FONDO ESPAÑA MISSIOLÓGICAL RESEARCH Introduction: How and why we started. The work of Missiological Research begins in my life after living seventeen years of pastoral experience and having
New Presbyterian Congregations
 The U.S. Congregational Life Survey New Presbyterian Congregations Deborah Bruce Katie Duncan Joelle Kopacz Cynthia Woolever 2013 Published by Research Services A Ministry of the Presbyterian Mission Agency
UK to global mission: what really is going on? A Strategic Review for Global Connections
 UK to global mission: what really is going on? A Strategic Review for Global Connections Updated summary of seminar presentations to Global Connections Conference - Mission in Times of Uncertainty by Paul
CANADIAN EVANGELICAL MISSIONS ENGAGEMENT STUDY METHODOLOGY
 CANADIAN EVANGELICAL MISSIONS ENGAGEMENT STUDY METHODOLOGY Faith Today Publications, 2017 Toronto, Ontario ISBN 978-0-9813248-6-9 (Electronic/PDF) Canadian Cataloguing in Publication Data Hiemstra, Rick
Presbytery of New Harmony Evaluation & Long Range Planning Committee Update Report to the Stated Meeting of Presbytery May 9, 2017
 Presbytery of New Harmony Evaluation & Long Range Planning Committee Update Report to the Stated Meeting of Presbytery May 9, 2017 Recent events in the life of our denomination have presented us with exciting
ATTACHMENT (D) Presbytery of New Harmony Evaluation & Long Range Planning Committee Update Report to the Stated Meeting of Presbytery October 10, 2017
 Presbytery of New Harmony Evaluation & Long Range Planning Committee Update Report to the Stated Meeting of Presbytery October 10, 2017") Presbytery of New Harmony Evaluation & Long Range Planning Committee Update Report to the Stated Meeting of Presbytery October 10, 2017 Recent events in the life of our denomination have presented us with
Presbytery of New Harmony Evaluation & Long Range Planning Committee Update Report to the Stated Meeting of Presbytery October 10, 2017 Recent events in the life of our denomination have presented us with
Parish Needs Survey (part 2): the Needs of the Parishes
: the Needs of the Parishes") By Alexey D. Krindatch Parish Needs Survey (part 2): the Needs of the Parishes Abbreviations: GOA Greek Orthodox Archdiocese; OCA Orthodox Church in America; Ant Antiochian Orthodox Christian Archdiocese;
By Alexey D. Krindatch Parish Needs Survey (part 2): the Needs of the Parishes Abbreviations: GOA Greek Orthodox Archdiocese; OCA Orthodox Church in America; Ant Antiochian Orthodox Christian Archdiocese;
BAPTIST ASSOCIATIONS
 THE STATE OF BAPTIST ASSOCIATIONS PERCEPTIONS, PARTNERSHIPS, AND PATHWAYS FORWARD A REPORT PRODUCED BY JASON LOWE DIRECTOR OF MISSIONS PIKE ASSOCIATION OF SOUTHERN BAPTISTS Copyright 2017 by Jason Lowe.
Pastor Views on Tithing. Survey of Protestant Pastors
 Pastor Views on Tithing Survey of Protestant Pastors 2 Methodology The phone survey of 1,000 Protestant pastors was conducted August 30 September 18, 2017 The calling list was a stratified random sample,
The Reform and Conservative Movements in Israel: A Profile and Attitudes
 Tamar Hermann Chanan Cohen The Reform and Conservative Movements in Israel: A Profile and Attitudes What percentages of Jews in Israel define themselves as Reform or Conservative? What is their ethnic
NUMBERS, FACTS AND TRENDS SHAPING THE WORLD FOR RELEASE DECEMBER 30, 2013
 NUMBERS, FACTS AND TRENDS SHAPING THE WORLD FOR RELEASE DECEMBER 30, 2013 FOR FURTHER INFORMATION ON THIS REPORT: Alan Cooperman, Director of Religion Research Cary Funk, Senior Researcher Erin O Connell,
Factors related to students focus on God
 The Christian Life Survey 2014-2015 Administration at 22 Christian Colleges tucse.taylor.edu Factors related to students focus on God Introduction Every year tens of thousands of students arrive at Christian
University System of Georgia Survey on Student Speech and Discussion
 University System of Georgia Survey on Student Speech and Discussion May 2008 Conducted for the Board of Regents University System of Georgia by By James J. Bason, Ph.D. Director and Associate Research
JEWISH EDUCATIONAL BACKGROUND: TRENDS AND VARIATIONS AMONG TODAY S JEWISH ADULTS
 JEWISH EDUCATIONAL BACKGROUND: TRENDS AND VARIATIONS AMONG TODAY S JEWISH ADULTS Steven M. Cohen The Hebrew University of Jerusalem Senior Research Consultant, UJC United Jewish Communities Report Series
El Monte Community Assessment. A report by Elder Monte Sahlin Center for Creative Ministry August 2011
 El Monte Community Assessment A report by Elder Monte Sahlin Center for Creative Ministry August 2011 1 Who is Monte Sahlin? An ordained Seventh-day Adventist minister for 40 years who has done assessments
Catholic Equity and Inclusive Education Consultation Findings
 Catholic Equity and Inclusive Education Consultation Findings In a review of consultation responses the following general themes/patterns emerge: There is some support for the policy as it is currently
COMMUNITY FORUM CONVERSATIONS. Facilitation Guide
 COMMUNITY FORUM CONVERSATIONS Facilitation Guide In the twenty-first century, Jewish community life is changing in ways both large and small. At the same time, we believe we share an enduring aspiration
Part 3. Small-church Pastors vs. Large-church Pastors
 100 Part 3 -church Pastors vs. -church Pastors In all, 423 out of 431 (98.1%) pastors responded to the question about the size of their churches. The general data base was divided into two parts using
RECOMMENDED CITATION: Pew Research Center, July, 2014, How Americans Feel About Religious Groups
 NUMBERS, FACTS AND TRENDS SHAPING THE WORLD FOR RELEASE JULY 16, 2014 FOR FURTHER INFORMATION ON THIS REPORT: Alan Cooperman, Director of Religion Research Greg Smith, Associate Director, Research Besheer
Pastors Views on Immigration. Survey of American Protestant Pastors
 Pastors Views on Immigration Survey of American Protestant Pastors 2 Methodology The phone survey of 1,000 Protestant pastors was conducted January 14-30, 2019 The calling list was a stratified random
REACH UP TO GOD. engaging in daily bible study networks for daily Bible reading and study.
 SID DRAFT STRATEGIC PLAN DOCUMENT 2016-2020 REACH UP TO GOD Objectives Action Plans Objective Outcome Indicator (baseline assume 2013 survey data, OR December 2015 reports TBD)) 1.1. Promote daily personal
State of Christianity
 State of Christianity 2018 Introduction Report by Jong Han, Religio Head of Research Peter Cetale, Religio CEO Purpose To inform on the overall state of Christianity and the churches in the United States
for E XCELLENCE Evaluation Worksheets Your Snapshots The Kingdom Perspective
 The Kingdom Perspective Look through the kingdom lens. What do you see in your church and Sunday School ministry to give evidence that the focus truly is on the kingdom of God and not the kingdom of self,
Resolution Related to a Comprehensive Urban Ministry Strategic Plan
 Resolution Related to a Comprehensive Urban Ministry Strategic Plan Submitted by: Commission on Urban Ministry Presenters: Robin Hynicka and Lydia Munoz Whereas, the Commission on Urban Ministry is charged
Guide to Adopting A People By the Frontier Mission Alliance
 Guide to Adopting A People By the Frontier Mission Alliance The Rationale In our world today there are an estimated 24,000 ethno-linguistic groups each with their own dialect and cultural tradition. The
Position Description. Minister of Student and Family Ministries. VISION STATEMENT Discipleship Evangelism Service
 Position Description FBC MISSION STATEMENT Friendship Baptist Church is a church where Christ is magnified; through individually and collectively presenting ourselves to Christ as a living and holy offering.
GRANTS FOR MINISTRIES WITH YOUNG PEOPLE United States Applicants
 GRANTS FOR MINISTRIES WITH YOUNG PEOPLE United States Applicants Application due JUNE 1 st (FOR 2016 FUNDING) Return application to: Young People s Ministries Attn: Grants Administrator PO Box 340003 Nashville,
INTRODUCTION. Vital-ARe-We-4.pdf, or by ing
 INTRODUCTION FACTS about Local and Global Mission Programs and Giving A Report of UCC Results from the FACT Study Marjorie H. Royle, Ph.D. Clay Pots Research November, 2011 This report is one in a series
Pastors Views on the Economy s Impact Survey of Protestant Pastors
 Pastors Views on the Economy s Impact 2018 Survey of Protestant Pastors 2 Methodology The phone survey of 1,000 Protestant pastors was conducted August 29 September 11, 2018 The calling list was a stratified
EXECUTIVE SUMMARY. A Seminary of Intentional Relationships Delivering Theological Education. For the 21 st Century
 EXECUTIVE SUMMARY A Seminary of Intentional Relationships Delivering Theological Education For the 21 st Century The Strategic Planning Team of Saint Paul School of Theology was created and called into
Missions Purpose, Strategy & Policy
 Missions Purpose, Strategy & Policy (Please revise to best define your missions program) I. DEFINITION, PURPOSE, & POLICY A. Definition of Missions Name of your church defines missions to be any evangelistic
Manmite Pastors9 Response
 Manmite Pastors9 Response Domestic Abuse Isaac I. Block, Mennonite Brethren Bible College Can the Mennonite Church in Winnipeg, through its official and traditional offices engage in significant ministries
Executive Summary Clergy Questionnaire Report 2015 Compensation
 45 th Anniversary of the Ordination of Women Executive Summary Clergy Questionnaire Report 2015 Research and Evaluation, Office of the Presiding Bishop Evangelical Lutheran Church in America Kenneth W.
American Congregations Reach Out To Other Faith Traditions:
 American Congregations 2010 David A. Roozen American Congregations Reach Out To Other Faith Traditions: A Decade of Change 2000-2010 w w w. F a i t h C o m m u n i t i e s T o d a y. o r g American Congregations
DIOCESE OF TRENTON FAITH IN OUR FUTURE
 Table of Contents AN OVERVIEW OF COLLABORATION... 2 PASTORAL CONSIDERATIONS REGARDING COLLABORATION... 3 PASTORAL CONSIDERATIONS REGARDING LINKED PARISHES... 4 PREPARING FOR IMPLEMENTATION... 6 ANNUAL
Religio. State of Catholicism. Introduction Report
 Religio State of Catholicism Introduction Report By Jong Han Head of Research Religio Purpose: To inform on the overall state of Catholicism and the Catholic church in the United States through generational
Occasional Paper 7. Survey of Church Attenders Aged Years: 2001 National Church Life Survey
 Occasional Paper 7 Survey of Church Attenders Aged 10-14 Years: 2001 National Church Life Survey J. Bellamy, S. Mou and K. Castle June 2005 Survey of Church Attenders Aged 10-14 Years: 2001 National Church
Faith Communities Today
 Faith Communities Today UU Survey Results Analyzed By The Reverend Charlotte Cowtan January, 2002 Faith Communities Today Page 1 Introduction Early in the year 2000, Faith Community Today survey was sent
Bethlehem Lutheran Church, Minneapolis, Minn. Biblical Fluency Project
 Bethlehem Lutheran Church, Minneapolis, Minn. Biblical Fluency Project Part of the Vibrant Congregations Project, a Lilly Foundation grant administered by Luther Seminary A. Quick Facts Congregation Name:
Pastor Views on LGBT Serving and Marriage Requests. Survey of Protestant Pastors
 Pastor Views on LGBT Serving and Marriage Requests Survey of Protestant Pastors 2 Methodology The phone survey of Protestant pastors was conducted March 9-24, 2016 The calling list was a stratified random
Nativity of the Blessed Virgin Mary 2016 Parish Survey EXECUTIVE SUMMARY
 Nativity of the Blessed Virgin Mary 2016 Parish Survey EXECUTIVE SUMMARY Survey Respondent Profile Quantitative research in the form of a parish-wide survey o Administered at all Masses during one weekend
Pastor Plans for Super Bowl Sunday Activities. Survey of Protestant Pastors in Churches Typically Conducting Sunday Night Activities
 Pastor Plans for Super Bowl Sunday Activities Survey of Protestant Pastors in Churches Typically Conducting Sunday Night Activities 2 Methodology The phone survey of Protestant pastors was conducted August
New Research Explores the Long- Term Effect of Spiritual Activity among Children and Teens
 New Research Explores the Long- Term Effect of Spiritual Activity among Children and Teens November 16, 2009 - What is the connection between childhood faith and adult religious commitment? Parents and
Trends in International Religious Demography. Todd M. Johnson Gina A. Zurlo
 Trends in International Religious Demography Todd M. Johnson Gina A. Zurlo World Christian Encyclopedia 1 st edition World Christian Database World Religion Database www.worldchristiandatabase.org
URBAN CHURCH PLANTING STUDY Stephen Gray & LifeWay Research
 URBAN CHURCH PLANTING STUDY STUDY PARTICULARS 15 church planting groups participated in this study Church plants were started between 2003 and 2006 Urban was defined according to the church s zip code
Studying Religion-Associated Variations in Physicians Clinical Decisions: Theoretical Rationale and Methodological Roadmap
 Studying Religion-Associated Variations in Physicians Clinical Decisions: Theoretical Rationale and Methodological Roadmap Farr A. Curlin, MD Kenneth A. Rasinski, PhD Department of Medicine The University
Results from the Johns Hopkins Faculty Survey. A Report to the Johns Hopkins Committee on Faculty Development and Gender Dr. Cynthia Wolberger, Chair
 Faculty Survey Full Report Results from the Johns Hopkins Faculty Survey A Report to the Johns Hopkins Committee on Faculty Development and Gender Dr. Cynthia Wolberger, Chair by The Johns Hopkins Biostatistics
ISLAMIC BANKING INDEX BY EMIRATES ISLAMIC. Page 1
 ISLAMIC BANKING INDEX BY EMIRATES ISLAMIC 2017 Page 1 Introduction Islamic banking continues to grow globally, with the UAE at the forefront of a dynamic effort to broaden its appeal. Despite a challenging