ROMAN CATHOLIC DIOCESE OF LONDON Pastoral and Personnel Planning Statistical Projections and Analysis Report
|
|
|
- Terence King
- 6 years ago
- Views:
Transcription

1 ROMAN CATHOLIC DIOCESE OF LONDON 2011 Pastoral and Personnel Planning Statistical Projections and Analysis Report September 15, 2011


2 1070 Waterloo Street London, Ontario N6A 3Y Fax: September 15, 2011 Dear colleagues and fellow parishioners, In 1991, planning consultant Fred Galloway was invited by the diocese to provide projections of clergy numbers for a fifteen year horizon. Given the changes we face, it is timely now to update our projection of the number of priests available for parish ministry and to undertake a broader collection and analysis of demographic, sacramental, financial and personnel data. For this work, we are grateful to Fred Galloway, the primary author of this report. The following document identifies challenging pastoral and personnel realities that many of us know intuitively. Its publication is representative of the Diocese of London s ongoing commitment to be transparent and accountable, and to improve the quality of our dialogue and decision-making. The trends surfaced in this report reflect significant shifts in our communities, both over the past twenty years and in the years to come. The potential impacts of these profound changes require thorough discernment, wise decisionmaking and bold action. Pastoral planning at all levels must engender a Church committed to the building up of the body of Christ, responding effectively and compassionately to people in need. Personnel planning must address short-term, pressing needs while developing a longerterm vision for priestly, diaconal and lay ecclesial ministry roles. St. Peter s Seminary and the Institute for Catholic Formation are key partners in offering formation and ongoing educational opportunities for these roles of ministry. The diocese is committed to providing for and supporting competent servant leaders who will respond faithfully and effectively to emerging pastoral needs. We face change with hope in the Lord, recalling God s promise in Jeremiah 29:11... For surely I know the plans I have for you, says the Lord, plans for your welfare and not for harm, to give you a future with hope. May God inspire and guide us and those we serve to respond with generosity and love. In Jesus, Andrew Bartley, MDiv, MBA Episcopal Director of Pastoral Leadership Rev. Stevan Wlusek Episcopal Vicar for Formation and Support
3 Table of Contents 1 INTRODUCTION DIOCESAN POPULATION TRENDS AND PROFILES INTRODUCTION SOCIETAL TRENDS Population Age Profiles The Changing Face of Canada Technology and Globalization Loss of Affinity Volunteerism DIOCESAN GEOGRAPHICAL AREA DEMOGRAPHIC PROFILE Introduction Deanery population profiles Diocesan Population Profile SACRAMENTAL, MASS ATTENDANCE, PARISH AND OTHER STATISTICAL PROFILES INTRODUCTION SACRAMENTAL PROFILES Baptism First Communions Confirmations Marriages Funeral and Burials Summary AVERAGE WEEKEND MASS ATTENDANCE COUNTS PARISHES, MISSIONS, CATHOLIC COMMUNITIES AND CATHOLIC POPULATION PROFILES PARISH CONSOLIDATED COLLECTIONS REVENUES SUMMARY PARISH PRIEST AVAILABILITY INTRODUCTION PARISH PRIEST AVAILABILITY REPORT PARISH PRIEST AGE PROFILES Table of Contents i
4 TO 2025 PARISH PRIEST AVAILABILITY TO 2025 PARISH PRIEST AVAILABILITY PROFILE UNITED STATES DATA PERMANENT DEACON AVAILABILITY PARISH LAY ECCLESIAL MINISTERS AND STAFF PROFILE 1975 TO CATHOLIC SCHOOL BOARD PUPIL PROJECTIONS SUMMARY CONSOLIDATED TRENDS GRAPHIC KEY THEMES SUMMARY APPENDIX I.. Selected Base Line Diocesan Collected Data APPENDIX II... Pastoral Plan for the Diocese of London APPENDIX III... Letter from Bishop Fabbro and Synopsis of Report, for Inclusion in Parish Bulletins September 17-18, 2011 Table of Contents ii
5 1 INTRODUCTION Over the last twenty years, the has undertaken various independent statistical collection and analysis initiatives in support of pastoral and personnel, human resources and related planning functions. In 1990, a fifteen year projection report on priest availability in parish ministry was completed. In subsequent years, church attendance, deanery demographic, sacramental participation, parish profile and other data collection projects have also been completed. Some of these initiatives have been ongoing, while others have been undertaken on a one time basis. In the fall of 2010, the Diocese identified an opportunity to continue the development of multi-year projections on priest availability. In the course of these discussions, it was felt that a broader-based, integrated data collection and analysis initiative would benefit long term strategic planning for pastoral, personnel and other functions within the Diocese. To support such a broad initiative, a project team was assembled to bring together multiple statistical dimensions that would assist in strategic planning and decision-making related to pastoral and personnel planning. This data included the age of parish priests, deacons, lay ecclesial ministers and other staff; recruitment and terminations (attrition) for the various personnel categories; parish activity data associated with the sacraments and three year average weekend mass attendance; school board student population projections; and other data sets. A project brief was prepared that focused on the following pastoral and personnel planning statistical projections and analysis initiative. To collect and analyze a range of data that will support strategic discussions and decision-making on pastoral and personnel planning, human resources and other related functions within the. The data utilized in this report has been collected by various staff and departments within the Diocese Chancery Office. This data comes from multiple sources and may not have been consistently collected across the years in all cases. Therefore, some of the statistical data may require some additional interpretation or assumptions resulting in some potential loss of precision on a more finite basis. However, the broader strategic trends are evident from the data provided. Some of the base line data collected by the Diocese is located in Appendix I. Appendix II provides the Pastoral Plan for the Diocese of London. Page 1-1
6 2 DIOCESAN POPULATION TRENDS AND PROFILES 2.1 INTRODUCTION The following population trends and profiles are shaping the demographics and values of many people living in Southern Ontario. 2.2 SOCIETAL TRENDS Population Age Profiles It has long been known, that Canada is experiencing, particularly in its urban environments, an ageing population driven by the Boomer generations which is currently approximately 49 to 64 years of age. This generation constitutes approximately 30% to 32% of the population in Ontario. Also over the same period, particularly since the late 1960s, the birth rate in Canada has declined dramatically to the point that natural population replacement is not achievable. The birth rate stands at approximately 1.5 children per female adult when the replacement rate is approximately 2.2. The birth rate has declined annually for over three decades, but did have a marginal increase in As a result, three major trends have evolved: Federal government policy focusing on increased immigration to the country to offset population losses; In the last ten years, the children s age cohorts have stabilized or marginally declined in absolute numbers in some regions, but have a decline absolutely relative to their proportion of the total population; Social policy is increasingly focusing on public health / health care as the Boomer generation ages and their health requirements become an increasingly important focus to this generation; Rural Ontario is generally depopulating at a rate of up to 2% a year as the population ages and younger people leave for post-secondary education and / or employment, and then do not return. The aging trend has resulted in the youth age cohorts stabilizing in absolute numbers but not necessarily declining in some areas. However, their proportionality within the population is declining. This is a significant change, particularly related to social policy development that for decades after the 1950s focused on youth at a young age and then as young adults with significant investments in elementary and secondary schools, post-secondary school institutions, community recreation and many other sectors. However, the change in population mix has resulted in a significant increase and the drawing of resources towards public health which is an older aged population priority Page 2-2
7 The ageing phenomenon of the population will continue well into the 2020s and beyond, and will continue to impact public policy and financial investments, particularly related to public health The Changing Face of Canada Canada has identified that it requires 250,000 to 300,000 net new immigrants per year in order to sustain a population of approximately 33 million to 34 million. Government policy has developed a variety of programs to attract immigrants from around the world, which has been a historical development strategy for the country. What has uniquely changed in the last two decades, and particularly through the late 1990s to today, has been the ever-increasing targets for immigration, now 250,000 to 300,000 a year, as well as the source of immigration. Historically, new immigrants to Canada came from northern Europe, followed by Eastern Europe. These were the founding ethno-cultural groups for the country and throughout its development into the 1950s. Today, some 70% to 80% of the new immigrants come from Africa, the Middle East, the Far East and South America. These are non-traditional sources for which Canada has had limited cultural integration experience. Also, many of the immigrants coming to Canada have differing ethno-cultural, religious and life experiences that are not as aligned with the Canadian experience as for previous generations and employment. This profile of immigration has created significant settlement challenges that are both typical and unique. Typical challenges would be in the areas of language, family development, education, engagement and related elements. Some of the newer considerations involve different cultural values, religious systems that are not well known or understood in Canada or cultural practices that are not aligned with Canadian expectations and traditions. This mix of challenges results in the need to become more knowledgeable of the immigrant experiences for which some have had horrendous backgrounds related to violence, wars, torture, etc. For the Catholic Church, this shift in immigration sources is unique as few Catholics come from Africa, the Middle East or Far East. Only South America is a source of new Catholics from these geographies. This trend could impact the rate of Catholic family growth in Ontario over the long term, after years of high Catholic immigration from Europe Technology and Globalization The levels of investment in research and technology continue to grow around the world. As a result, there is a continuing stream of new information on techniques, methods, approaches and strategies in the delivery of social and community services. Much of the new information can often refute or overwhelm previous practices. In concert with research are the significant day-to-day changes that evolve in the world of technology. Technology covers many domains, communications, operations, service delivery techniques, accountability and reporting requirements, etc. An organization s ability to not just acquire technology, but to train its staff and stakeholders to use it to its capacity and to sustain continuing investments as technology changes significantly on a regular basis, is another key success factor. Page 2-3
8 One of the key technology trends is social media. Proportionately fewer under thirty-five year olds read newspapers, newsletters; have land lines; etc. They are reliant on Facebook, Twitter, apps, etc. to receive information and to communicate. Organizations who are not strongly committed to these technologies will be increasingly marginalized by the younger generations and others, who over time as they age, become the dominant population group. Also tied into social media, is the interest in globalization. For younger people, the world they live in is much smaller and goes beyond their local communities. These perspectives change the relevancy, communications and value parameters for people. Organizations who cannot adapt to this fast growing reality will become more isolated and less engaged Loss of Affinity Another emerging trend within society is the reduction in affinity that people have with institutions, suppliers and others. This is particularly notable amongst younger generations and expressed in the emerging perspective of what have you done for me today. The impact of this trend can alter traditional and counted-on relationships that have existed historically and with which all parties to the relationship had significant comfort. Also, amongst younger populations, the relationship perspectives are uniquely different. They look for greater value, the newest trends or technology, or what is given the greatest focus in popular culture and communications. Some examples are the continuing changing of mobile telephone contracts, not always for price, but simply for applications and look. Other indicators of changing relationships include how customers switch banks and insurance companies; the changing membership profiles at golf courses and clubs where people are looking for packages rather than single venues; and deteriorating perspectives about government, education, community service providers and others who engage with the public. For Christian Churches, the loss of institutional affinity over one generation has been significant, with most denominations indicating sharp reductions in attendance and participation on a regular basis. Another generation of such a trend will likely reshape main line Christian faiths related to congregations, perceived value, engagement and related historical strengths. The decline in institutional affinity is pervasive at one level. For churches, it is driven by perceived reduced relevancy, new forms of communications, education, changing societal values, globalization, civil litigation and loss of moral authority due to abuse, and people s increasing ability to separate their need for a church structure from their basic faith and values Volunteerism Volunteerism has long been a mainstay of many community service providers, churches, etc. There has been substantive activity by the volunteers in a host of roles. However, significant changes are occurring around volunteerism. The first trend that is noticeable, is that people seem to have less time for volunteerism or interest in such activity. Often today, it is not that difficult to recruit volunteers for a project with a defined time period but it is often much more difficult to get a commitment on a longitudinal-basis, such as sitting on a Committee or to be involved in an on-going program. This reflects more of the short attention span that people have and their desire to get in and out and not necessarily to make longer term commitments. Also affecting volunteerism, is the increasing scrutiny and red tape associated with volunteers. The need for police checks, the negative press stories about a few volunteers, the expectations of volunteers to be Page 2-4
9 able to do what staff do, and in many cases, the lack of recognition and value for volunteers. As a result, program and operational volunteers tend to be harder to find but still represent a significant and valued resource for any community-based organization. 2.3 DIOCESAN GEOGRAPHICAL AREA DEMOGRAPHIC PROFILE Introduction In establishing the overall population profile for the diocese on a geographical basis, Census Canada data for the diocese and by deanery has been developed. The key data dimensions have involved total population, age, ethnicity and other dimensions for 1996 and The data will provide an understanding of the population transitions that are occurring in the general population. Data on religious affiliation that emerges periodically within Census Canada data, and common law families which started in 2001, was utilized based on 2001 availability Deanery population profiles a) Introduction The following data examines the 1996 to 2006 general population profile changes for each of the seven deaneries within the Diocese of London as depicted below. Page 2-5
10 2.3.2.b) Windsor Deanery Table 1 profiles the Windsor Deanery. Table 1 Windsor Deanery Change # % # % # % Population 197, , , Age Profile , , , , , , , , , , , , , , , , , , , , , , Median Age % 15 years or older Immigrant Population 46, , , Visible Minority Population 24, , , Catholic Affiliation (2001) 99, n/a n/a n/a n/a Familes 42, , , Common Law (2001) 5, , Lone Parent 9, , , The following points are identifiable: From 1996 to 2006, the Windsor Deanery population increased by 18,779 individuals, up 9.5% to 216,473 residents. This is a growth rate of just under 1% per year which is a typical non-greater Toronto Area (GTA) growth rate; From an age perspective, the age profile for the Windsor Deanery has gone up, with the median age increasing one full year from 36.5 to 37.5 years of age or 2.7%. Also, the percent of the population over the age of fifteen has grown by.7 of a percentage point, up.9%; In the zero to four, twenty to twenty-four and the sixty-six to seventy-four age cohorts, all had decreases in the absolute numbers of people within those age frames, while all the other age cohorts have growth. The largest single area of growth was the fifty-five to sixty-four year olds at 27.6% reflecting the boomer population moving through to those age frames from the twenty-five to fifty-four year cohort. This aging process will continue as the boomers age and will be even larger in the 2011 census; The five to fourteen and the fifteen to nineteen age cohorts both show 10.1% and 11.5% growth respectively which reflects the eco-boomer children moving through these age cohorts and some growth in younger aged families. However, the zero to four age cohort, by 2006, had decreased Page 2-6
11 by 2.2% and was down almost 300 children reflecting a trend that will be further represented in the school pupil population projections; The immigrant population has grown from 23.4% or just over 46,000 individuals in 1996 to almost 60,000 individuals or 27.7% of the population in This is an increase of 13,600 individuals or nearly 30% for identified immigrants in the Windsor population from 1996 to 2006; As a further demonstration of the New Canadian population, the visible minority population in the Windsor Deanery has grown from 24,800 individuals to over 45,000 individuals, now constituting 20.8% of the population of Windsor in 2006, an increase of 81.7% over the ten year period; Catholic affiliation was identified in the 2001 census. For the Windsor Deanery, it was just under 100,000 individuals representing 47.7% of the population, reflecting nearly one of every two Windsor Deanery residents self-identifying themselves as being of the Catholic faith; The number of families in the Windsor Deanery has increased by 39.3%, nearly 17,000 even within the context of an aging population. This growth reflects the fact that the new families are significantly smaller in size, decreasing from 4.6 to 3.7 members by Family formation remains strong, but the number of children and individuals in families is decreasing; In 2001, 9.4% of the families were in common law relationships, representing nearly 5,400 families. By 2006, this category had grown to over 6,000 families or 10.2% of the families mix; Lone parent families constituted 23.3% of the total number of families in the Winsor Deanery in This category was nearly 20.8% of families in 2006, an increase of 2,410 families, up 24.3%. Though the absolute number of lone parent families grew, the percentage declined as overall family formation increased more than this category. The lone parent family proportion of the family population in the Windsor Deanery is the highest by a significant margin for all the deaneries in the London Diocese. In summary, the Windsor Deanery population is self-identified as almost 50% Catholic, has grown by 9.5% over the ten years between the censuses, is aging, has had a significant growth in the proportion of the immigrant population within the population and has seen growth in the common-law and lone parent proportions of the family population, with the lone parent proportion being the highest in the diocese c) Essex Deanery Table 2 profiles the Essex Deanery population based on the census data with the following characteristics: Page 2-7
12 Table 2 Essex Deanery Change # % # % # % Population 152, , , Age Profile , , , , , , , , , , , , , , , , , , , , , , , Median Age % 15 years or older Immigrant Population 23, , , Visible Minority Population 5, , , Catholic Affiliation (2001) 86, n/a n/a n/a n/a Familes 38, , , Common Law 3, , Lone Parent 4, , , The overall population has grown by nearly 16%, from 152,600 individuals to almost 177,000 individuals, up over 24,000 people. This is a faster growth rate than for the City of Windsor, increasing approximately 1.6% per year; The zero to four age cohort has shown a decline in the absolute numbers of individuals, down 4.6% or 500 individuals over the timeframe. All the other age cohorts have shown growth, however, the highest growth rate is amongst the fifty-five to sixty-four year olds, up 52.1% or nearly 6,600 individuals. The second highest growth rate is in the seventy-five plus age cohort, up 47.0%. The median age has increased by.5, up 1.4%, while the percentage of the population that is fifteen years of age or older has increased by 2.6 percentage points; up 3.4%; The immigrant population within the Essex Deanery has grown by nearly 3,500 individuals. It was 14.6% of the population in 1996, and represents 15.4% of the population in Proportionately, immigrant population growth has not aligned with general population growth, as its proportionality has decreased by.2% over the ten years; The visible minority population has grown by 91.2%, from 5,300 to 10,200 individuals, and in 2006 represented 5.8% of the population. Therefore, within the immigrant population, the largest growth component has come from the visible minorities sector; Catholic affiliation in 2001 was 52% of the population, the highest in the Diocese of London, representing 86,500 people; Family formation has grown considerably in the Essex Deanery, up nearly 30% from 38,400 families in 1996 to nearly 50,000 families in Smaller family sizes are identified, 4.0 in 1996 and 3.5 in 2006; Page 2-8
13 Common law families have grown by 2006 to 7.9% of all Essex Deanery families, representing nearly 4,000 families, up 690 families or 21.2% from 1996; Lone parent families have increased by 1,370 families, or 32.0% over the time period. In 2006, they represented 5,650 families. In summary, the Essex Deanery has an evident aging profile and has one of the highest population growth rates in the Diocese due to development in Lakeshore, Tecumseh, LaSalle and Amherstburg, and along the Lake Erie shore. The percentage of the population over fifteen years of age has grown considerably as has the immigrant population, with a particular focus on the arrival of visible minorities as the largest growth component of this population group. Catholic affiliation, on a self-identified basis, is the highest in the Diocese at 52.0%. Family formation continues to grow, up 30%, and there is significant growth within the common law and lone parent family categories d) Sarnia Deanery Table 3 profiles the population for the Sarnia Deanery which covers the City of Sarnia and Lambton County. The following demographic characteristics are identified: Table 3 Sarnia Deanery Change # % # % # % Population 128, , Age Profile 0-4 8, , , , , , , , , , , , , , , , , , , , , Median Age % 15 years or older Immigrant Population 15, , , Visible Minority Population 3, , Catholic Affiliation (2001) 35, n/a n/a n/a n/a Familes 31, , , Common Law (2001) 3, , Lone Parent 4, , The population has decreased marginally over the period by 775 people or.6% of the 1996 population; Only the twenty to twenty-four, the fifty-five to sixty-four and seventy-five plus year old cohorts have shown increases in population proportionality. The two older age cohorts have shown significant increases of 38.4% to 41.7% respectively; The younger age cohorts have shown declines in proportionality and losses in absolute numbers. The zero to four cohorts is down almost 2,000 children, some 23.7% over the ten year period, while the five to fourteen year old age cohort is down over 3,800 children, or 20%; Page 2-9
14 The median age has risen from 38.6 to 42.8 years, up six full years on average or 16.3%. The percent of residents over the age of fifteen has grown by 4.5 percentage points or 5.7%; The immigrant population has declined by 1,290 individuals from nearly 16,000 to 14,700 or 8.1%, reflecting the declining population. The visible minority proportion of the general population has increased by 330 individuals or 10.9%; Catholic affiliation in 2001 was 27.9% or 35,400 people who identified themselves as Catholics; The number of families has grown from 31,700 to 37,500, up over 5,500 families or 8.4%. Family size has fallen from 4.1 to 3.4 individuals; Common law families have increased by 545 or 16.1%, while lone parent families have increased by nearly 900 or 28% between 1996 and In summary, Lambton County has experienced a marginal decline in population plus a substantial aging of its population, with over 5,700 fewer zero to fourteen year olds in the population profile. The immigrant population has declined with the out-migration of people though the visible minority population has increased by 330 individuals. Catholic affiliation is at approximately 28% or 35,000 individuals, while family formation has increased with smaller family sizes. Both common law and lone parent families have shown significant growth over the ten year period e) Kent Deanery Table 4 examines the demographic profile for the Kent Deanery. Table 4 Kent Deanery Change # % # % # % Population 109, , , Age Profile 0-4 7, , , , , , , , , , , , , , , , , , , , , Median Age % 15 years or older Immigrant Population 10, , Visible Minority Population 3, , Catholic Affiliation (2001) 38, n/a n/a n/a n/a Familes 26, , , Common Law (2001) 3, , Lone Parent 4, , The following characteristics are identified: Page 2-10
15 The population has declined by 1.3% or 1,473 individuals, being 108,200 people in 2006; Significant aging has occurred in the population with the highest growth in fifty-five to sixty-four and seventy-five plus age cohorts. Significant declines have occurred in the zero to four and five to fourteen age cohorts; The median age has increased from 4.7 years or 12.8%, while the percent of the population over the age of fifteen years has grown by 3 percentage points or a growth of 3.9%. The immigrant population has decreased by 185 individuals, or down by 1.7%, now standing at 10,800 individuals. The visible minority population has grown by 880 people, up 23.9% between 1996 and 2006; Catholic affiliation in 2001 stood at 35.5% or 38,120 individuals; Family formation has grown by 5,035 units or 19.3% over the ten years, with the average family size declining from 4.2 to 3.5 individuals; Both common law and lone parent families have increased, common law families by 23.1% up 700 families, while lone parent families were at 4,680, an increase of 13.5% in The Kent Deanery has shown a marginal decrease in population over the ten years of nearly 1,500 individuals. The population is aging significantly similar to the Sarnia Deanery. The immigrant population has declined as out migration has occurred though the visible minority population has grown by almost 24%. Catholic affiliation is at over one third of the population. Family formation has increased by just over 19% or 5,000 families, but family size has decreased to 3.5 individuals per family. Both common law and lone parent families have increased significantly within the family mix between 1996 and f) London Deanery Table 5 examines the demographics for the London Deanery. The following demographic characteristics are identified: Population growth of over 38,800 individuals or 8.1% has occurred over the period, indicating a growth rate of approximately.8% per year; An evident aging profile is demonstrated with a decline in the zero to four population of 5,216 individuals or 16.1%, as well as the five to fourteen age population. The largest growth by age cohort was amongst the fifty-five to sixty-four and the seventy-five plus year olds; The median age has increased by three full years or 8.4%, while they percent of the population over the age of fifteen has increased 3.0 percentage points or 3.8%; The immigrant population has increased by 9%, or over 7,800 individuals, representing in % of the population or nearly 95,000 people; The visible minority portion of the population has grown nearly 20,000 individuals or 63.6%; Catholic affiliation was at 26.7%, or nearly 130,000 individuals in 2001; Page 2-11
16 Family formation has increased by 33,530 families, growing 30.9%. Family size has decreased from 4.3 to 3.6 members; Common law families have grown by 2,840 families to 20.5% of the family population, while lone parent families have increased by 24.3% or 4,460 families to be 16.1% of the family mix within the London Deanery by Table 5 London Deanery Change # % # % # % Population 468, , , Age Profile , , , , , , , , , , , , , , , , , , , , , , , , Median Age % 15 years or older Immigrant Population 86, , , Visible Minority Population 31, , , Catholic Affiliation (2001) 129, n/a n/a n/a n/a Familes 108, , , Common Law (2001) 13, , , Lone Parent 18, , , In summary, the London Deanery has shown modest population growth of 8.3%, with a significantly aging population. The two youngest age cohorts are experiencing declines and the older age cohorts are increasing. The immigrant population has increased significantly, greater than the growth in the general population and visible minorities have grown by almost two thirds. The Catholic population is selfidentified in the 2001 census at nearly 130,000 individuals. Family formation has been strong with a growth of 33,500 families or 30.9%. Significant growth has occurred within both the common law and the lone parent family units within the family mix g) Huron Perth Deanery Table 6 examines the population profile for the Huron-Perth Deanery. Page 2-12
17 Table 6 Huron-Perth Deanery Change # % # % # % Population 132, , , Age Profile 0-4 9, , , , , , , , , , , , , , , , , , , , Median Age % 15 years or older Immigrant Population 10, , Visible Minority Population 1, , Catholic Affiliation (2001) 24, n/a n/a n/a n/a Familes 32, , , Common Law 3, , Lone Parent 3, , The following demographic characteristics are identified: A modest increase in population of just over 1,300 individuals over the ten years, or 1%, resulting in a growth of.1% per year; The population is aging significantly with declines in both the proportion and absolute number for the zero to four and five to fourteen age cohorts of 17.0% and 11.6% respectively. The fifty-five to sixty-four and the seventy-five plus age cohorts had the highest growth rates; The medium age has grown by 4.1 per years or 11.2%, while the percent of the population fifteen years of age or older has grown by 2.4 percentage points or 3.1%; The immigrant population has increased by 735 individuals or 6.8%, to be 8.7% of the total population in The visible minority population has grown by 585 individuals or 32.1%, now representing 2,405 people. The visible minority portion of the immigrant population has grown more substantively and represents most of the immigrant population growth; Catholic affiliation in 2001 was 18.0% or 24,000 individuals; Family formation has grown by 5,170 families or 15.9%. Average family size has moved from 4.1 members in 1996 to 3.5 members in 2006; Common law and lone parent families have both grown significantly within the family mix. Common law families grew by 590 individuals or 17.9% and now represent 10.3% of all families. Lone parent families have grown by 19.9% or 710 families, representing 11.3% of the family mix. In summary, the Huron-Perth Deanery has shown marginal growth within an aging population, with significant declines in the zero to four and five to fourteen age population. The immigrant population has grown but predominately due to the growth in the visible minority population. Catholic affiliation is Page 2-13
18 approximately 24,000 individuals. Family formation continues to grow, up 15.9% over the ten years, with both common law and lone parent families growing significantly within the family mix h) Ingersoll Deanery Table 7 examines the Ingersoll Deanery population profile. Table 7 Ingersoll Deanery Change # % # % # % Population 160, , , Age Profile , , , , , , , , , , , , , , , , , , , , , , Median Age % 15 years or older Immigrant Population 17, , Visible Minority Population 3, , Catholic Affiliation (2001) 34, n/a n/a n/a Familes 39, , , Common Law (2001) 4, , Lone Parent 4, , , The following demographic characteristics are identified: The population has grown by 3.1%, or approximately.3% a year, with just over 4,900 new individuals for a total population of 165,319 people; A strong aging profile is identified with the two youngest age cohorts, zero to four and fifteen to fourteen, declining 15.8% and 10.0% respectively. The largest growth rates are in the fifty-five to sixty-four and seventy-five plus age cohorts; The medium age has increased 5.6 years, up 15.8%, while the percentage of the population over the age of fifteen has grown by 3.4 percentage points or 4.3%; The immigrant population has grown by 965 individuals or 5.4%, representing nearly 19,000 individuals. The visible minority population has grown by 250 individuals or 6.4%, and now includes 3,580 individuals; Catholic affiliation is at 21.7% or almost 35,000 individuals in 2001; Family formation has grown by 38.0% or almost 15,000 families. There is now 53,920 families, with the average family size decreasing from 4.1 individuals in 1996 to 3.1 individuals in 2006; Both common law and lone parent families have grown as a percent of total families, 6.7% or 995 individuals for common law families, and 8% or 1,195 individuals for lone parent families. Page 2-14
19 In summary, the Ingersoll Deanery has experienced limited growth within a strong aging profile. Immigrant population and visible minorities have both shown some limited growth though significantly less than for other deaneries. Catholic affiliation stands at 21.7%. Family formation has grown by 38% or nearly 15,000 families with some increases in common law and lone parent families Diocesan Population Profile Table 8 summarizes the population profile for the diocese. The following perspectives are identified: The general population across the diocese has increased by 86,000 people or 6.4% from 1996 to 2006; The immigrant population has grown by over 25,000 or 11.8%, while the visible minority population has grown by 47,000 or 64.2%; The number of families has increased by 92,570 or 29.0%; Common law families have grown over 10,000 families or 29.8%, with lone parent families increasing by 11,600 families or 23.3%. Table 8 Diocesan Population Profile Change # # # # % Total Population 1,350,477 1,436,351 85, Immigrants 212, ,800 25, Visible Minorities 73, ,080 46, Families 318, ,355 92, Common Law 33,675 43,700 10, Lone Parent 49,550 61,143 11, Catholic Population # 448,125 % 32.1 Table 9 consolidates the deaneries across the diocese for the general population information. The following outcomes are identified: The Windsor Deanery has increased from 14.6% to 15.1% of the general population across the Diocese, and in 2001, 50.3% were Catholics and was home to 22.2% of diocesan Catholics. For the Essex Deanery, the proportion of the diocesan general population has grown from 11.3% to 12.3%,, and was 56.7% Catholic in 2011 and home to 19.3% of diocesan Catholics; For the Sarnia Deanery, its population has fallen from 9.6% to 8.9% of the general population across the diocese. It was 29.1% Catholic in 2011 and home to 7.9% of diocesan Catholics; For Kent County, the proportion of general population across the diocese has declined from 8.1% to 7.5%. It was 34.7% Catholic in 2001 and home to 8.5% of diocesan Catholics. Page 2-15
20 In the London Deanery, the proportion of the general population within the diocese has grown from 34.7% to 35.3%, and in 2011, 28.9% of diocesan Catholics lived in this deanery which was 29.7% Catholic; For the Huron-Perth Deanery, its proportion of the general population representation has declined from 9.8% to 9.4%. This deanery represented in 2001, 5.4% of the Catholics in the diocese, with an 18.1% Catholic population; For the Ingersoll Deanery, the general population proportionality has declined from 11.9% to 11.5%, and this deanery was home to 7.8% of diocesan Catholic, in 2001 with a Catholic population of 18.1%; In total, in 2001, the Catholic population represented 32.5% of the general population across the diocesan geographical area. Table 9 Diocesan Deanery Population Profile Percentage 2001 Catholic 2001 % of Point Change Affiliation Diocesan Catholic # % # % % # % Pop. Pop. Windsor 197, , , Essex 152, , , Sarnia 128, , , Kent 109, , , London 468, , , Huron-Perth 132, , , Ingersoll 160, , , TOTAL 1,350, ,436, , The key trends identified from the broader population and demographic assessment is as follows: The increasing urbanization of the population in the diocese, as the rural areas decline in population and the urban areas grow which reflects farm consolidation, rural depopulation and younger people moving out for post-secondary education and non-farm work; The increasing proportionality of immigrants, especially visible minorities, within in the urban populations, with some depopulation of immigrant families in more rural areas; The strong aging profile of all the deaneries, with particular emphasis on some of the rural areas where significant declines in the zero to four and the five to fourteen age cohorts were identified; Increases in the number of families across the diocese with decreasing family sizes both common law and lone parent families both grew in presence in the family mix; Approximately one in three individuals living within the general population of the diocese identified themselves in the 2001 census as Catholic. Page 2-16
21 Significant demographic trends are occurring in the population. One that should be noted is the significant growth in New Canadians. Based on broader data that is used for trends analysis, for last ten to fifteen years, the majority of New Canadians have come from the Middle East, Far East, Africa and South America. These are non-traditional sources of New Canadians. They also represent areas of the world that have significantly smaller Catholic populations, particularly in the first three identified. Historically, immigration to Canada has been from the Mediterranean, British Commonwealth, Northern and Eastern Europe. Many of these countries, such as Poland, Ireland, Italy, etc. have significant Catholic populations. It is likely, that the immigration trends to Canada will see fewer Catholics among the New Canadians, which will over longer term, reduce the proportionality of Catholics within the general diocesan population. Page 2-17
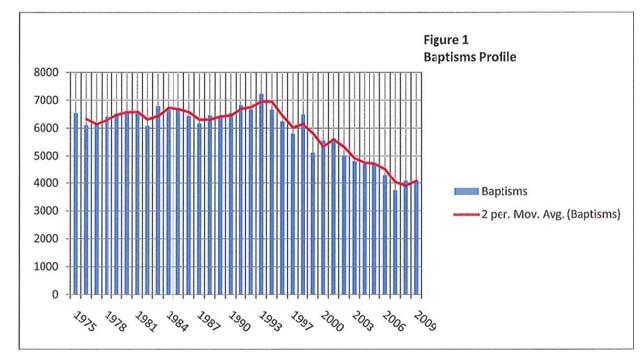
22 3 SACRAMENTAL, MASS ATTENDANCE, PARISH AND OTHER STATISTICAL PROFILES 3.1 INTRODUCTION Over the course of the last thirty plus years, data has been collected or is available in regards to a number of the sacraments available to Catholics in the diocese within their parishes. Also, for the 2008 to 2010 period, average mass attendance counts were taken for each of the three years to develop projections by parish, deanery and diocese relative to average weekend mass attendance. The following data provides the figures and tables associated with the information provided to the consultant. The data has some inconsistencies in terms of a year that may be missing in the data set, different starting points in terms of when data was first collected and other factors that may need to be considered in the assessments. 3.2 SACRAMENTAL PROFILES Baptism Figure 1 profiles baptismal activity in the diocese since approximately 1975 through to The following assessments are provided based on the bar graph: Up until 1993, which had the highest number of baptisms at 7,236, there was a general upward movement in the number of baptisms per year. Starting in 1994, there has been an ongoing decline, particularly after The highest point for baptisms was in 1993, the lowest activity level was in 2007, 3,742. This represents a high to low decline of 48.3% baptisms; Since 2007, baptisms have increased marginally to approximately 4,080 per year; The decline in baptisms was particularly evident in 2001, but they have been consistently declining since the peak in The reasons for the reduction in baptisms could be multi-fold: An aging population which decreases the proportionality of children aged zero to six in the population, particularly in rural areas where population declines average 1% to 2% per year; Reduced affinity amongst some Catholics who are detached from the Church to have their children receive sacraments First Communions Figure 2 profiles first communion activity for the period 1988 to It also provides background bars relative to baptismal activity for the same period. The following perspectives have been identified: Page 3-1
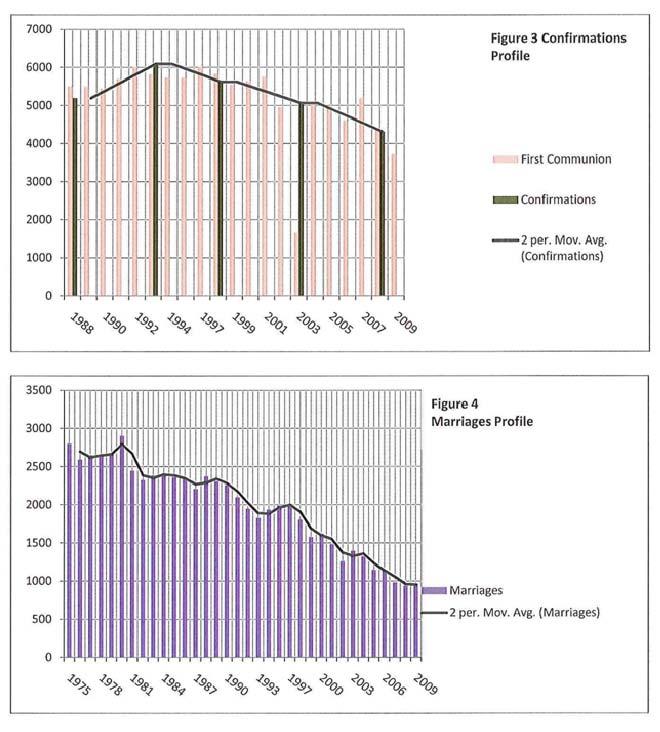
23 The peak first communion activity years were 1992 at 6,026 and in 1997 at 6,021; The lowest year was 2003 at 1,655; Generally, up to 2004, baptismal activity achieved a higher activity level than first communions. Since 2004, first communions generally have had a higher incident rate than baptisms. This occurs partly because of a declining birth rate and baptismal activity occurring outside of the school system, compared to first communion activity where most children receive the sacrament while in the school system which is a different type of access and availability. It could also represent the fact that there is a seven year delay generally between a baptism and first communion which is impacted by continuing declining birth rates; Overall, first communions, starting in approximately 2000, have shown some decline with a sharp decline in 2003, followed by a stable activity period, and then declines in 2008 and The data shows a 72.5% decline between the highest and lowest years. However, taking out the one low year in 2003, the high to low reduction is 38.3%. On average over the period, 5,184 first communions were recorded per year Confirmations Figure 3 profiles confirmation activity in the diocese from 1988 to The following statistical assessments are provided: Confirmations grew consistently from 1988 to a peak of 6,091 in 1993; Since 1993, there has been a consistent decline in confirmations, falling to 4,306 in 2009, a decline of 29.3% Marriages Figure 4 profiles marriage activity in the diocese between 1975 to The following statistical perspectives are identifiable: There has been a significant decline in annual marriages from 2,800 in 1975 to 967 in 2009, a 65.5% drop; The data indicates a consistent decline on nearly an annualized basis from 1975 through to 2009, resulting in 1975 being the peak year; The decline in marriages would reflect newer perspectives on marriage amongst younger people, and in more recent years, the post- boomer generation has declined in terms of the actual number of younger people in the population proportionately Funeral and Burials Table 10 profiles the funeral activity across the Diocese for the years 1995 to The number of burials range from a high of 2,823 in 1995 to a low of 2,095 in The data indicates some decline on a marginal but erratic basis across the fifteen year period. The decline has been relatively consistent on an annual basis since Page 3-2
24 Table 10 Funerals by Year for the Diocese Year Funerals Change # -509 % Note: These totals represent all Parishes that submitted their profiles in the specified year Not all Parishes have submitted their 2010 profiles In total, the decline in the number of funerals between the high and low marks has been 509, or 18.3%. Table 11 profiles the burial activity in Diocesan Cemeteries in Windsor, London and Sarnia in five year increments for the years 1975 to Windsor London Sarnia Total Table 11 Total Burials by Year Windsor, London and Sarnia Diocesan Cemeteries 1975 to to 2010 Change # % N/A ,358 1,491 1,536 1,569 1, Location Heavenly Rest Cemetery, since 1990, has had the most significant number of burials, at over 50% of total burials. Page 3-3
25 The burial activity has increased year over year. For Heavenly Rest Cemetery, the increase has been from 104 burials in 1995 to 815 in For St. Peters Cemetery in London, it has increased from 244 to 423 burials. For Resurrection Cemetery in Sarnia, it has increased from 111 burials in 1980 to 2,053 in For the twenty year period 1980 to 2010 for which data is available, Heavenly Rest Cemetery has increased its annual burials by 618.3%% or 711 burials; St. Peters Cemetery 55.5% or 151 burials; and Resurrection Cemetery 127.9%, 142 burials. For all Diocesan Cemeteries, the number of burials since 1980 has increased by approximately 1,000 or 200%. The growth in burials in the three largest Catholic Cemeteries in the Diocese has shown consistent growth, particularly since In comparison, the number of funerals in the Diocese has actually been declining over the period Summary Across these four sacraments, the activity profiles indicate similar declines in activity levels. For marriages, the decline has been since 1975 when data collection started. For the other three sacraments, the declines became evident after peaking in and around The decline ranges from almost twothirds for marriage to nearly 30% for confirmations. 3.3 AVERAGE WEEKEND MASS ATTENDANCE COUNTS For the years 2008, 2009 and 2010, parishes have undertaken selective weekend counts of attendance at mass on identified weekends. The precision of the data is variable by parish, tending to be higher in 2008 due to influences around parish reorganization in the years prior to For 2009 and 2010, the data maybe more precise but remains dependent on the accuracy efforts undertaken by individual parishes. Figure 5 illustrate the average mass attendance by deanery. For all deaneries except Ingersoll, 2008 was the peak year. For the Essex Deanery evident declines have occurred for both 2009 and For the other deaneries, the 2009 and 2010 averages tended to be similar to each other, or in the case of Windsor, 2010 was slightly higher than for The data also indicated, as one would expect, a higher intensity of weekend mass attendance in the more urbanized centres of London, Windsor and Essex compared to the more rural or smaller geographical areas of the diocese. Page 3-4
26 Page 3-5
27 Page 3-6
28 In parallel to Figure 5, Table 12 illustrates the average parish weekend mass attendance by deanery and the diocese as a whole, along with growth / decline assessments. Table 12 Average Parish Weekend Mass Attendance by Deanery & the Diocese Parishes % Parishes Variance Average indicating decline # % / Parish Windsor Essex , Sarnia Kent London , Huron Perth Ingersoll Total Diocese 68,578 64,816 64,656-3, # of Parishes Average / Parish Parishes Indicating Decline # % For the Essex Deanery, the following perspectives are identified for its fifteen parishes: for each of the three years, a decline in average weekend mass attendance was indicated; 75.0% of the parishes in the deanery experienced declines from 2008; Page 3-7
29 The total decline across the deanery was 1,367 people or 10.9% of total deanery attendance between 2008 and 2010; The decline represented 85 individuals per parish on average over the period. For the London Deanery and its twenty-three parishes and seven Catholic communities, the following is identified: 61.2% of the parishes indicated declining attendance; The total decline in attendance was 1,302 individuals, representing 6.3% of total weekend mass attendance compared to 2008; The decline represented 50 individuals per parish on average. For the Ingersoll Deanery and its nine (9) parishes and two Catholic communities, the following is identified: 22.2% of the parishes had experienced a reduction in average weekend mass attendance; Attendance had increased overall in the deanery by 61 individuals per parish, an increase of 1.3% for the deanery; The average increase per parish was 7 individuals. In the Huron-Perth Deanery and its sixteen parishes, the following was found: 64.7% of the parishes experienced a decline in average weekend mass attendance; The decline was 447 individuals on average per weekend or 7.5% of total deanery 2008 weekend mass attendance; Parishes experienced on average, 26 fewer individuals attending. For the Sarnia Deanery and its nine parishes and one Catholic community, the following was identified: 70.0% of parishes experienced a decline between 2008 and 2010; The total decline for the deanery was 199 individuals on average or 4.4% of average weekend mass attendance in 2008; The reduction represented 20 individuals per parish. For the Kent Deanery and its fourteen parishes and one Catholic community, the following was identified: 62.8% of the parishes experienced a decline in average weekend mass attendance; The decline in attendance was 623 on average across the deanery from 2008 levels, representing an 8.8% reduction; Page 3-8
30 Kent parishes experienced 39 fewer attendees on average in 2010 than for 2008; For the Windsor Deanery and its twenty parishes and three Catholic communities, the following is identified: Some 41.1% of the parishes experienced a reduction in average weekend mass attendance; The decline in attendance across the deanery was approximately 45 individuals or.3% of total average weekend mass attendance in 2008; The individual parishes experienced a reduction on average of approximately 3 individuals. At a diocesan level, the following outcomes emerged from the data: Total average weekend mass attendance moved from 68,578 individuals in 2008 to 64,656 in From the data, the following is identified: o o An average weekend mass attendance decline from 2008 to 2010 of 3,922 individuals, or 5.7% of the 2008 levels; A reduction in average weekend mass attendance, for the 111 parishes, of 35 individuals per parish; o Average parish weekend mass attendance across the diocese has gravitated from 618 individuals to 583 individuals from 2008 to 2010; o 64 of the 111 parishes, or 57.7%, experienced a reduction in average weekend mass attendance from 2008 to The data indicates the incremental lowering of averaging mass attendance for the 2008 to 2010 period. The Ingersoll Deanery had the fewest parishes experiencing a reduction and was the only deanery to experience a gain in average weekend mass attendance over the period. The Windsor Deanery remained relatively the same for each of the years of the period, with a 2009 reduction followed by an increase in The other deaneries experienced incremental reductions in average weekend mass attendance, ranging from a high 10.9% in Essex to a low of 4.4% in Sarnia. 3.4 PARISHES, MISSIONS, CATHOLIC COMMUNITIES AND CATHOLIC POPULATION PROFILES Table 13 profiles the number of parishes, missions and Catholic communities in the diocese based on diocesan data starting in 1975 and Census Canada population data. The data indicates the following: There were 143 parishes in 1975 and 106 in This is a decline of thirty-seven parishes or 25.9%; In 1975, there were thirty missions. In 2005, there were twenty-one missions, a reduction of 9 or 30.0%. In 2006, missions were discontinued. They became part of a parish, Catholic community or were closed. The number of parishes and Catholic communities, as well as the discontinuation of missions, reflects the results of parish reorganization that has been ongoing in the diocese for the last ten years. Page 3-9
31 Also, included in Table 13 is Catholic population and general population data for 1975 to 2010 for the Diocese of London s geographic area. It has been sourced from diocesan research and Census Canada data. In 1975, approximately 286,000 Catholics resided in the Diocese and constituted 25.5% of the general population. By 2000, the Catholic population had risen to 404,121 or 30.5% of the general population. In 2010, the Catholic population is estimated at 444,310 people and 26.9% of the general population. The data is impacted by the fact that Census Canada has not collected religious affiliation data in its five year census since Based on the Table 13 data, there has been a growth in the number of Catholics in the Diocese of 158,349 individuals or 55.5% between 1975 and This proportionately has been effected over the last ten years and will continue to be impacted downwards as immigration from traditionally non-christian countries continues to grow as forecasted by the federal government. Year Parishes Missions* Table 13 Diocesan Parishes, Missions and Population Profiles Catholic Communities Catholic Population* Total Population* Proportionate % Catholic ,961 1,120, ,405 1,203, ,255 1,205, ,361 1,222, ,121 1,293, ,121 1,293, ,310 1,645, ,310 1,645, Change # , ,663 % Notes: Missions - From 2006 onw ards the term "Mission" w as no longer used. Catholic Communities - denotes a stable community that does not offer or is not required to offer a full-range of pastoral services provided by a Parish. The term can be used to denote a former Parish w ith declining population and resources or can signify a new Community that has the potential of becoming a Parish Population* - Number of Catholics in the geographiocal region for the Diocese of London. Total Population* - General population figure in the geographical region for the Diocese of London. Census Canada data on religious affiliation w as terminated in 2001 & prior to that only included in the Census every second cycle Table 14 examines the parish and catholic community deanery distribution in terms of numbers, percentages and the service ratio using 2001 Catholic population data and the 2011 parish deanery distribution information provided by the Chancery. Page 3-10
32 The data indicates that for the 106 parishes, 21.6% of parishes are in London, with between 14% and 19% are in Essex, Huron-Perth and Windsor. Ingersoll and Sarnia have 8.5% of the parishes, with Kent having 13.2%. In terms of Catholic communities, there are fourteen, of which one half are in London, three or 21.4% are in Windsor and two or 14.2% are in Ingersoll. The Kent and Sarnia deaneries have one each. In terms of the ratio of the parish distribution to the Catholic population, using 2001 Catholic population data, Huron-Perth has the highest service ratio of one parish to every 1,500 Catholics, followed by Kent with one parish to every 2,528 Catholics. Ingersoll and Sarnia have similar ratios of one parish to approximately 3,900 to 4,000 Catholics, while the more populated communities of Essex, Windsor and London have service levels of approximately one parish to 5,000 to 5,800 Catholics. Service levels are higher in the large urban centres, reflecting less travel time and the urban development framework compared to the multiple small communities in the rural areas of the diocese that historically each had their own parish. The overall diocese ratio is one parish for every 4,227 Catholics. Table 14 Parish and Catholic Community Deanery Distribution Deanery Parishes Catholic Communities 2001 Catholic Populations Parish to Catholic Population Ratio Windsor ,525 1:4,976 Essex ,580 1:5,772 Sarnia ,395 1:3,993 Kent ,120 1:2,723 London ,680 1:5,638 Huron-Perth ,005 1:1,500 Ingersoll ,820 1:3,869 TOTAL ,125 1:4227 Note: Missions: from 2006 onwards the term "Mission" to denote a non-paraochial Church was discontinued. Generally missions were closed with parish Reorganization beginning in PARISH CONSOLIDATED COLLECTIONS REVENUES Table 15 profiles the Parish Consolidated Collection Revenues across the Diocese for the period 1994 to 2010 for seventeen years. For the Offertory / Sunday Envelope / Loose Collections, revenues have increased from approximately $20.3 million to $24.1 million. This is an increase of $3.9 million per year or 15.9%. For the Easter / Christmas Collections, the growth in income has been from $1.9 million to $2.3 million, an increase of $377,000 per year or 16.5%. For The Sunday Offertory Collections, the increase has averaged $242,638 a year, or approximately 1.2%. For the Easter / Christmas Collections, the increase has averaged $23,553 a year, or 1.5%. The growth in collections is hovering slightly less than inflation for the period. On a year to year basis, the Offertory Collection showed growth from 1995 through to After 2001, negative year to year changes are identified for six of the years, with only three years, 2004, 2005 and Page 3-11
33 2006 having positive growth. The highest year to year growth years were 1994 to 1995, 4.2%, and 1999 to 2000, 5.4%. The largest decline year to year, was 2006 to 2007, 3.7 %. For the Easter / Christmas Collections, a similar pattern is identified as for the Sunday Offertory Collections. Up until 2001, there had been annual increases year to year. In 2002, a decline over 2001 is identified at 2.4%, and only three years after that have year to year increases. The largest year to year increase was 1997 to 1998, 6.1%. The largest decline year to year, was 2007 to 2008, 8.6%. This could reflect the impact of the recession which was in full bloom in In summary, the data indicates approximately six years of growth year to year and then declines year to year moving forward. However, the overall growth across the seventeen years is almost $4 million for Sunday Offertory Collections, and almost $377,000 for the Easter / Christmas Collections. However, almost all this growth occurred between 1994 and For the Sunday Offertory Collections, there has been an actual decline of almost $750,000 from the peak year 2001 to 2010, $241,000 for the similar period for the Easter / Christmas Collections. Table 15 Consolidated Parish Revenue Collections 1994 to 2010 Year Offertory/Sunday Annual Easter/Christmas Annual Ended Env./Loose % Change Collections % Change ,267,972 1,911, ,117, ,043, ,312, ,086, ,106, ,145, ,726, ,276, ,248, ,323, ,501, ,470, ,854, ,529, ,705, ,469, ,655, ,527, ,849, ,493, ,173, ,395, ,929, ,459, ,979, ,450, ,672, ,240, ,578, ,299, ,090, ,288, Change $ 3,882, ,853 % SUMMARY The sacramental and average mass attendance data indicates constantly declining levels of activity. For most sacraments, this began to occur at more evident levels post Some of the reductions in pre and school-age sacraments would be associated with declining birth rates, as further identified by the declining student populations in Catholic schools, particularly in rural areas. Page 3-12
34 There has been a reduction of twenty-nine parishes and fifteen missions between 1975 and There are now 147 parishes and catholic communities compared to 171 parishes and missions in Funerals have shown modest declines, while burials in Diocesan Cemeteries have grown significantly. In terms of average weekly mass attendance, one sometimes hears a figure of approximately 450,000 to 475,000 Catholics identified as residing within the Diocese of London by Based on 2010 average weekend mass attendance of 64,656 individuals, this would result in an average participation range by London Diocese Catholics of 13.6% to 14.4% per weekend average. Page 3-13
35 4 PARISH PRIEST AVAILABILITY 4.1 INTRODUCTION Over the last two decades, priest availability for parish ministry in the Diocese of London has been examined on two levels. The first is the inclusion of the 1991 report results. This has been followed by the preparation of new projections based on a significantly higher level of data that has been collected over the last number of years by the diocese involving age, retirement, attrition and related availability variables. The following chart profiles the 2011 Diocesan Incardinated Priests profile by positions. Number of Diocese of London Incardinated Priests 151 Number of Retired Priests 59 Number of Priests on Leave of Absence 3 Number of Priests in Designated Ministry, (Seminary, Hospital and Administration) 18 Number of Priests Ministering Outside Diocese 2 Number of Priests in Parish Ministry PARISH PRIEST AVAILABILITY REPORT 1991 TO 2005 PARISH PRIEST AVAILABILITY Table 16 provides the parish priests projections per diocesan incardinated and non-incardinated priests completed in 1991 for the 1991 to 2005 period. Religious order priests were not incorporated into the projections as there was no data on ordination, attrition, retirement or sabbatical rates. This table indicated that there were 178 incardinated and non-incardinated diocesan parish priests available for active parish duty in 1991, including eleven priests not in parishes but potentially available upon reassignment. The forecast was that this figure would fall to between 125 to 146 in 1995, 89 to 120 by 2000 and 62 to 100 by Two different projection models were utilized as there was no data on priest retirements, attrition, etc. and estimates had to be made. The final number in 2005/2006 was in the area of 109 parish priests. Therefore, the projections were relatively accurate considering the number of priests recruited from other countries and related perspectives that occurred during the 1991 to 2005 period. Page 4-1
36 Table to 2005 Incardinated and Non-Incardinated Parish Priests Projected Availability Profile 1991 to to to 2005 A B A B A B Annual Active Parish Start of Period Estimate Retirements During Period (33) (42) (28) (29) (23) (20) Active Losses During Period (10) (20) (10) (20) (10) (20) Loss due to covering Non-Parish Retirments (1) (3) (3) (2) (2) (2) New Diocesan Priests additions During Period Annual Active Parish Priests End of Period Cumulative Reduction # Cumulative Reduction % Compounded Annual Rate of Decline 3.9% 7.2% Note: A&B reflect two different models of retirement and attrition profiles as no data was collected on these themes in PARISH PRIEST AGE PROFILES and 2011 age profile comparisons have been developed for diocesan incardinated, non-incardinated and religious order priests working in parish ministry. Table 17 illustrates the 2011 parish priests age profile for the total number of priests ministering in Diocese of London parishes. This data includes Diocese incardinated priests, non-incardinated priests from other dioceses and religious order priests ministering in parishes. This data does not include priests who are in non-parish roles. The following age perspectives are outlined. Diocese Incardinated Priests Table Parish Priest Age Profile Non-Incardinated Religious Order Priests Priests TOTAL # % Cumulative % # % Cumulative % # % Cumulative % # % Cumulative % TOTAL Page 4-2
37 For Diocesan incardinated priests working in parish ministry, 37.7% of the priests are fifty years of age or younger and 62.3% of the priests are fifty-one years of age or older, of which 36.2% are over the age of sixty. Assuming a retirement age of seventy, 25 of the current incardinated priests working in parish ministry would be retiring within the next ten years; For non-incardinated parish priests, eleven are identified, of which 72.7% are fifty years of age or younger and 27.3% are older than fifty. They have a younger age profile than the incardinated priests working in parish ministry; For religious parish priests, there are twenty identified, of which 20% are under the age of fifty and 80% are fifty-one years of age or older. Some 35% are sixty-one years of age or older which represents a significant loss of priest availability in the next ten years depending on retirement age assumptions for this category; From a total parish priest perspective, some 37.0% of current parish priests are fifty years of age or younger and 63.0% are fifty-one years of age or older. Some 37 parish priests are sixty-one years of age or older and could be retiring in ten years; The youngest two age cohorts of parish priests, twenty-five to thirty and thirty-one to forty years of age, represent only 10.2% of diocesan incardinated priests, three of the eleven non-incardinated priests and there are no religious priests in these younger age cohorts. Table 18 compares the 1991 diocesan incardinated parish priest s age profile for 1991 and The data indicates the following: Significant declines in all age categories, particularly the twenty-one to thirty, thirty-one to forty, sixty-one to sixty-five and the sixty-six to seventy age cohorts; A decline from 164 parish priests in 1991 to 69 in 2011, down 95 or 57.9% The data indicates the continuing aging perspective of the incardinated diocesan parish priest population where 30.5% were under the age of forty in 1991 compared to 13.6% by 2011, that is eight priests in 2011 compared to fifty in There have also been significant declines in the number of priests in the sixtyone to seventy age category. Page 4-3
38 Table and 2011 Diocesan Incardinated Priest's Age Profile Change # % Cumulative % # % Cumulative % # % TOTAL Table 19 profiles the non-incardinated priest age perspectives involving fourteen parish priests in 1991 and eleven in The decrease in incardinated priests has been limited to three or 21.4%. By 2011, almost three quarters of the incardinated priests were forty-one to fifty years of age as there were six compared to one in The age profile has actually become a little younger as the under-forty priests represent a 14.2% of the 1991 population compared to 18.2% in However, the dominant age group in 2011 is the forty-one to fifty year olds which enhances a younger age profile than in Table and 2011 Non-Incardinated Parish Priests Age Profile Change # % Cumulative % # % Cumulative % # % TOTAL Table 20 compares the 1991 to 2011 age profiles for religious order parish priests. Similarly, the data indicates a significant aging profile. In 2011, there are no religious order priests under the age of forty compared to six in There has also been a significant reduction in the seventy plus year old religious order priests from ten in 1991 to three to In total, the religious order parish priests have declined from forty-six in 1991 to twenty in 2011, down twenty-six or 56.5%. A further consideration is that the number of religious order / apostolic communities has declined from fifteen in 1991 to nine in 2011, down 40.0% Page 4-4
39 Table 20 Religious Order Parish Priests Age Profile Change # % Cumulative % # % Cumulative % # % unknown TOTAL From the data, parish priest availability will continue to be impacted by the age profile of the current parish priests, with significantly more priests sixty-one years of age and older than under the age of forty, a ratio of 2.7 older priests to one younger priest. The forty-one to fifty and the fifty-one to sixty age cohorts represent 60% of the priests currently working in parishes and reflect the last generations of substantial annual ordinations. It is interesting to note, that for the ten year period thirty-one to forty years of age, there are seven priests compared to the next ten year cohort, forty-one to fifty years of age, which has twenty-eight priests. This is a ratio of four to one to the older side. This ratio is influenced by the religious priests not having any priests in the two younger age cohorts TO 2025 PARISH PRIEST AVAILABILITY Tables 21 and 22 assist in developing the parish priest availability projections. Table 21 examines the forecasted graduations from St. Peter s Seminary for the Diocese of London priests for the period 2010 to The average addition is 1.7 per year and this figure has been used in the formula. Table 22 examines the average annual priest recruitment / attrition profiles in each of the priest availability categories including one incardinated priest in parish ministry required for administration roles every ten years to offset attritions and retirements in this category. For the non-incardinated and religious categories, attrition (leaves of absence, leaving the priesthood, deaths, etc.) exceed recruitment. An annual average availability factor has been developed for each of the three categories, which for diocesan incardinated priests, was approximately.5 of a priest per year, minus.8 of a priest for non-incardinated priests and minus 2.0 religious priests a year based on statistical patterns for 2004 to Page 4-5
40 Table to 2015 Diocese of London Projected Ordinations from St. Peter's Seminary TOTAL Average per year Table 22 Average Annual Parish Priest Recruitment (Ordination) / Attrition Profiles Dicoese Incardinated Non- Incardinated Religious Recruitments/Ordinations Attrition Administration Coverage Net Impact on Parish Priest Availability Another component of the parish priest availability assessment involved retirements and sabbaticals. Data was provided by the diocese that indicated that between 2011 and 2015, nine incardinated priests would retire, along with one religious and no non-incardinated priests. For the period 2016 to 2020, eleven incardinated priests, five religious order and one non-incardinated would retire. For the period 2021 to 2025, eleven incardinated, four religious order and one non-incardinated priests would retire. These projections were incorporated into the projection models. The data to this point, assumes no new or replacement non-incardinated or religious order priests. Therefore, unlike for incardinated priests with incoming priests for the seminary, these two categories will show significant declines only in this first level of analysis. A second level of analysis assumes replacement for all current non-incardinated and religious order parish priests. Relative to sabbaticals, the data indicated that there would be four sabbaticals for incardinated priests between 2011 to 2015, three for the period 2016 to 2020 and zero for the following five year period. No non-incardinated sabbaticals were identified and only one religious sabbatical was identified in the 2011 to the 2015 period. This data has also been incorporated on a five year average incremental basis. Table 23 examines the parish priest projections for incardinated priests from 2011 to 2025 in three five year increments. From a starting number of sixty-nine diocesan incardinated priests in parish ministry, the model projects a net incardinated parish priest availability of 61.5 in With the projected retirements, in 2020 there would be fifty-two incardinated priests and 42.5 in This would be a reduction of twenty-six to twenty-seven or 39.1% for incardinated priests working in parish ministry between 2011 and Page 4-6
41 Table 23 Five Year 2011 to 2025 Diocesan Incardinated Priest Projections Start Net Recruitments/Attritions Projected Retirements Sabaticals Net Incardinated Priest Availability Table 24 examines the same model projections for non-incardinated priests. It starts with eleven priests in 2011, with the loss of four over the five year period to 2015 resulting in seven non-incardinated parish priests available in This is lowered to two priests by 2020, and shortly thereafter, there would be no such priests available. Table 24 Five Year 2011 to 2025 Non-Incardinated Parish Priest Projections Start Recruitments/Terminations (-.8x5) Projected Retirements Sabaticals Net Non-Incardinated Parish Priest Availability Table 25 examines the same model projections for religious parish priests in the diocese. In 2011, there are twenty such priests and then significant reductions are identified. By 2015, there would be eight such priests, and shortly thereafter, there would be zero. Table 25 Five Year 2011 to 2025 Religious Order Parish Priest Projections Start Recruitments/Attrition (-2x5) Projected Retirements Sabaticals Net Religious Order Parish Priest Availability The non-incardinated and the religious order priests, based on the current date, would decline to zero availability shortly after Table 26 aggregates the projections data from Tables 23, 24, and 25 to reflect the universal parish priest availability profile. It indicates that by 2015, there would be seventy-seven parish priests available, fiftyfour by 2020 and forty-two, all diocesan incardinated priests, by By 2025, based on the accuracy of Page 4-7
42 the data provided and the assumptions made, there could a reduction of 58.0% in the number of parish priests available, falling from 100 in 2011 to forty-two in 2025 if non-incardinated and religious order parish priests leaving parish ministry were not replaced between 2011 and Table to 2025 Total Projected Priest Availability Profile Assuming No New / Replacement Non-London Diocese Diocese Incardinated Non-London Diocese TOTAL Net +/- # % Note: 1. Fractional figures in Table 23 rounded up for 2011 and down for Non-London Diocese includes non-incardinated and religious order parish priests This first level of analysis reflects a continuation of the patterns identified in the 1991 Parish Priest Availability Report. There is a series of assumptions and other perspectives that could change or alter the statistics. In potentially defining a range for parish priest availability, one could consider that availability by 2025 will likely fall between thirty and forty parish priests. The presence of religious priests and diocesan priests from other dioceses than London (non-incardinated priests ministering in our diocese) have been part of the diocese since its inception. Over the years, the needs of the diocese have been met in part by religious orders from Europe and South America to respond to language and particular pastoral needs. Recently, parish priest needs have been responded to in part by priests from South America, Asia and Africa where the Church is experiencing growth in the number of vocations. Currently, the diocese receives many requests for pastoral work opportunities from Bishops, Superiors and individual priests who seek to serve in the Diocese of London. The availability of these priests in the future could change the scope of the present priest projections outlined in Table 24. It has been the diocese s experience that religious orders normally take the responsibility to replace priests who go on sabbatical or who retire, based upon the approval of the Diocese of London. In the case of diocesan priests from other dioceses than London (non-incardinated priests ministering in the diocese), the Diocese of London takes the responsibility to find replacements. Another factor influencing religious order priest availability for parish placements was, that between 2004 and 2008, the diocese undertook a reduction in / consolidation of the number of parishes under the Parish Re-organization Program. This initiative reduced the level of recruitment of religious order priests during that time frame which had some impact in lowering the number of religious order priests in the diocese during that period and subsequently compared to what number may have been in place if parish consolidation had not occurred. Page 4-8
43 Table 27 profiles parish priest availability in the diocese assuming that all current non-incardinated and religious order parish-based priests who are lost to retirement or attrition are replaced on a one to one basis over the time period. This is a second level of analysis on parish priest availability that results from the previous paragraphs that indicate the flexibility and variability associated with the recruitment of nonincardinated and religious order priests for parish ministry. Table 27 indicates that the number of parish priests would decline from 100 in 2011 to seventy-three in 2025, a decline of twenty-seven parish priests or 27.0%. This decline is 46.7% less than outlined in Table 26, resulting in seventy-three parish priests versus forty-two parish priests. What Table 26 and 27 identify is that between 2011 and 2025, the diocese would need to recruit thirty-one non-diocesan priests, either non-incardinated or religious order, in order to sustain the current number of parish priests within these two categories. If that was achieved, as historically has occurred, the rate of decline and availability of parish priests would be approximately one half the rate of decline in availability based on the assumptions in Table 26. The data on parish priest availability addresses only quantitative considerations and perspectives on parish priest availability within the diocese. It does not address any qualitative considerations in the recruiting of non-diocesan priests. Quantitatively, the Diocese could have from forty-two priests to seventy-three parish priests by 2025 as Tables 26 and 27 demonstrate. Also, the age profile continues to grow evidently older. Table to 2025 Parish Priest Availabiity Profile Assuming Current Non-Dicoesan Parish Priests Are Replaced But No Growth Occurs Diocese Incardinated Non-London Diocese TOTAL Net +/- # % Note: Non-London Diocese includes nonincardinated and religious order parish priests TO 2025 PARISH PRIEST AVAILABILITY PROFILE Table 28 profiles parish priest availability for all three priests categories based on actuals from 1975 to 2010 and the projections from 2015 and 2025 for both non-diocesan non-replacement (A) and replacement (B) scenarios. Under scenario A, the data indicates a significant reduction in availability for the non-incardinated and religious order priests, a decline based on projections of 100% by approximately The decline for diocesan incardinated parish priests is 72.9% or 113 parish priests. In total, the reduction is 165 parish priests from the high of 207 in 1980, a decline of 79.7% between 1975 and Page 4-9
44 Under scenario B which replaces existing non-diocesan priest attritions and retirements, the total decline in parish priest availability is 134 priests or 64.9% from the high of 207 in For the diocese of London, parish priest availability will reach between forty-four priests if no offsetting of losses in non-diocesan priests occurs to seventy-three if such attritions are replaced on a one to one basis. Table TO 2025 Parish Priest Availability Actuals (1925 to 2010) and Projections (2015 to 2025) Year Diocese Incardinated Non Incardinated Religious Order TOTAL A B A B A B Change # (high) (high) % Table 29 Percent of Priests by Category for A and B Scenarios Year Diocese Incardinated Non-Dicoesan A B A B Note: Based on Table 28 data Page 4-10
45 Table 29 examines the percent distribution of diocesan and non-diocesan parish priests based on the A and B scenarios, A involving no replacements for non-diocesan and B assuming a one to one replacement ratio but no growth in the current numbers. The data indicates that in 1975 some 22.5% of parish priests in the diocese were non-diocesan. This has continued to grow to nearly 30% in 2000 and to over one third by However, based on the 2010 to 2025 data being added, under Scenario A, the result is the availability of non-diocesan priests moves to zero and therefore incardinated parish priests represent 100%. However, what may be more reflective of the situation is the Scenario B, which involves any loss of non-diocesan priests being replaced by recruitment by the diocese or through Memorandums of Understandings with religious orders, that would see 42.5% of parish priests by 2025 being non-diocesan. 4.6 UNITED STATES DATA Some comparison can be drawn from United States data. The Centre For Applied Research in the Apostolate at Georgetown University in a 2011 report, provided data on parish priest availability in the United States. Table 30 captures the data that was provided. It covers the 1960 to 2060 period. The data and projections indicate that parish priest availability will decline from 34,315 in 1960 priests to 11,779 in 2060 under current trends. On a twenty year incremental basis, the declines would be from a 26.8% at the high end to 12.6% at the low end. In total, there would be 22,536 fewer parish priests, a reduction of 65.7% or nearly two thirds of parish priests over the 100 year period. Table 30 United States Parish Priests Availability TOTAL 34,315 30,000 22,500 19,122 14,000 11, Year Change Increments # N/A -4,315-7,500-3,378-5,122-2,221-22,536 % N/A Page 4-11
46 5 PERMANENT DEACON AVAILABILITY Table 31 outlines the number of permanent deacons in active ministry in the Diocese from 1991 to Since 1995, the permanent diaconate s presence has evolved from two individuals to thirty-nine, up thirtyseven positions for the years data is available. Table 31 Permanent Deacon Profile 1991 to 2010 Year Permanent Diaconate Change # 37 % since 1995 In recent years, the Diocese has been assembling data on gender, age, location and related perspectives associated with the permanent diaconate. Table 32 provides the following information with regard to the age of the permanent deacons in active ministry. Table 32 Permanent Deacons by Age Profile Permanent Deacons DOL Non-Incardinated Total Age Cohorts # % # % # % 36 to to to to to to to TOTAL The following assessments are provided from the data: Page 5-1
47 There are thirty-nine permanent deacons in active ministry, of whom thirty-six are incardinated deacons and three are non-incardinated; The youngest permanent deacons fall within the forty-one to forty-five age range. There are only four permanent deacons under the age of fifty-five; Sixty-one percent of the permanent deacons are fifty-six to sixty-five years of age, and almost 33% or one third are over sixty-six years of age. Table 33 examines the location of the permanent deacons by Deanery. The following is identified: London has the highest concentration of permanent deacons, nine or 23% of the total; Essex and Kent have the second highest concentrations, at seven permanent deacons, or 17.9%; Windsor and Ingersoll have five permanent deacons each, accounting for 12.8% of the total in each Deanery; Sarnia has four permanent deacons, 10.2% of the total; Huron Perth has two permanent deacons, or 5.1% of those in active diaconal ministry. Table 33 Permanent Deacon Location by Deanery Profile Permanent Deacons # % Windsor Essex Sarnia Kent London Huron-Perth Ingersoll TOTAL Based on the data provided by the Diocese, Table 34 examines availability of permanent deacons for the 2010 to 2020 period. These projections are based on the following assumptions: The current average age of fifty-eight years at ordination will be maintained. There will be approximately ten ordinations every two years, based on the ordinations to date ( ; ; ) and the seven men expected to be ordained in November, There are twelve men in each of the current formation and Study Classes of 2013 and Not all these men may proceed to ordination. Page 5-2
48 Permanent deacons in the Diocese are required to submit their resignation, at age seventy, to the Bishop for his consideration. It is projected that permanent deacons will, on average, minister actively until the age of 72, health and other considerations permitting. Table 34 Diocese of London Permanent Deacons Availability Projections Availability Graduation Attrition Net Availability As a result, starting with thirty-nine permanent deacons in 2010, there are expected to be fifty-eight permanent deacons available in 2015 and sixty in This simplified data set indicates that there will initially be significantly more ordinations than attritions but that the number of permanent deacons will approach a plateau by Page 5-3
49 6 PARISH LAY ECCLESIAL MINISTERS AND STAFF PROFILE 1975 TO 2010 Table 35 outlines the number of lay ecclesial ministers and parish support staff within parishes in the Diocese between1975 to For Lay Ecclesial Ministers, the numbers have grown from nine to seventy-eight, an increase of sixty-nine such positions over the years, or 766.7%. For parish support staff, the increase has been from 462 individuals in 1995 to 513 people in This is a growth rate of 11.4% or fifty-one positions. The peak number of Lay Ecclesial Ministers and parish support staff was in 2000 followed by a decline to 2005, with some increase for Lay Ecclesial Ministers between 2005 and This later reduction in numbers could reflect the parish restructuring program undertaken by the diocese through those years. Table 35 Lay Ecclesial Ministers and Staff Profile 1975 to 2010 Year Lay Ecclesial Parish Ministers Support Staff N/A N/A N/A Change # % In recent years, the Diocese has been assembling data on gender, age, location and related perspectives associated with Lay Ecclesial Ministers. Table 36 provides the following information on various statistical perspectives on these human resources grouping. Page 6-1
50 Pastoral Ministers Parish Nurses The following assessments are provided from the data: Table 36 Lay Eccelesial Ministers by Age Profile Pastoral Ministers / Coordinators of Workers/Coordinators Youth Ministry of Youth Ministry Cumulative Age Cohorts # % # % # % # % # % % 20 to to to to to to to to to to TOTAL Total For pastoral ministers, seven, or approximately 18.5% are under the age of forty; thirteen or just over one third are between the ages of forty-one and fifty-five, and 48% are over the age of fiftysix; For parish nurses, all four are over the age of fifty-six; For the combined position of pastoral minister, worker and coordinators of youth ministry, there are only six, of which five are over the age of forty-six; For coordinators of the youth ministry, there are twenty-eight, with approximately one half being under the age of forty-five and one half being over that age. In total, there are 76 positions identified. Some 51% are under the age of fifty and approximately 49% are over the age of fifty, with 15.8% fifty-six to sixty years of age, 10.6% sixty-one to sixty-five years of age, and another 9.2% over the age of sixty-six. Table 37 provides the gender profiles of the seventy-six people in pastoral minister, pastoral minister/worker, parish nurses and coordinators of youth ministry roles. The following is identified: Seventeen or 22.3% of the seventy-six positions are male, and fifty-nine or 77.7% are female; All four parish nurses are female; Almost 86% of coordinators of youth ministry are female, as are almost 76% of the pastoral ministers. Page 6-2
51 Table 37 Lay Ecclesial Ministers' Gender Profile Male Female # % # % Total Pastoral Ministers Parish Nurses Pastoral Ministers / Workers / Coordinators of Youth Ministry Coordinators of Youth Ministry TOTAL Table 38 examines the lay ecclesial ministers deanery locational profile. In terms of the 76 positions, the following is identified: London has the largest concentration of these positions, twenty-four or 31.1% of the total; Essex and Windsor have the second highest concentrations, at seventeen and thirteen positions respectively, or 22.4 and 17.1%; Huron Perth has two positions, or 2.6% of the total positions; Kent, Ingersoll and Sarnia Deaneries have 11.8%, 7.9% and 6.6% of these positions respectively. There is a direct relationship between the concentration of these positions with the intensity of the urban population within the diocese, being concentrated in London, Essex and Windsor. Table 38 Pastoral Ministers Lay Ecclesial Ministers Deanery Locational Profile Parish Nurses Pastoral Ministers / Workers/Coordinators of Youth Ministry Coordinators of Youth Ministry Total # % # % # % # % # % Windsor Essex Sarnia Kent London Huron-Perth Ingersoll TOTAL Table 39 examines the 2004 to 2010 lay ecclesial ministry transitions for pastoral ministers and coordinators of youth ministry. During this time frame, the data indicates for pastoral ministers, that thirtyfour positions were recruited over the period, and there were thirty terminations resulting in a net reduction of four positions. Page 6-3
52 Table to 2010 Lay Ecclesial Ministry Position Transitions Pastoral Ministers Coordinators of Youth Ministry Recruitment 2004 to Attritions 2004 to Net Position 2004 to / Note: Of the thirty-eight Pastoral Minister attritions (pastoral ministers and pastoral case workers/parish nurses) twenty-two retired and one is deceased. For coordinators of youth ministry, there were thirty positions recruited during 2004 to 2010, with twentyseven terminations, resulting in a net gain of three such positions across the Diocese. The pattern for the last six years would indicate relative stability with some pluses and minuses in each of these two human resource roles. The recruitment of such positions is not as impacted by the training requirements that are associated with priests or permanent deacons, and therefore, there may be broader opportunities to recruit these parish staff positions. The factors associated with the availability of these individuals and their skills at the parish level appears to be is influenced more by need, affordability and related factors. In summary, the lay ecclesial ministers across the diocese, reflect a population with an average age of fifty years. These positions are significantly focused on female incumbents, 77.7%. There is also a direct relationship between deanery locational placement for these positions and larger urban centres. Page 6-4
53 7 CATHOLIC SCHOOL BOARD PUPIL PROJECTIONS Table 40 examines the Diocesan Catholic School Board Pupil Projection trends. This involves five school boards, the Windsor Essex Catholic District School Board, the St. Clair Catholic District School Board, the London Catholic District School Board, the Huron-Perth Catholic District School Board and the Counseil scolaire ecoles de district des ecoles catholique du Sud-Ouest. The data from the five boards is collected differently in terms of the last three years, as well as how projections are developed. Some boards project to a longer term, i.e / 2020, while other boards only projected out to 2013 to Table 40 Diocesan Located Catholic School Boards Pupil Population Trends 2008/09 to 2013/14 Variance +/- SCHOOL BOARDS 2008/ / / / /2020 # % WECDSB Elementary Secondary TOTAL 16,339 15,768 15,307 12,800 N/A -3, ,556 8,649 8,850 8,100 N/A ,895 24,417 24,157 20,900 N/A -3, SCCDSB Elementary Secondary TOTAL 7,184 6,945 6,697 6,482 6, ,210 3,153 3,028 2,803 2, ,394 10,098 9,725 9,285 9,034-1, LCDSB Elemntary Secondary TOTAL 12,362 N/A N/A 11,066 10,232-1, ,651 N/A N/A 7,731 6, ,013 N/A N/A 18,797 16,735-2, H-PCDSC Elementary Secondary TOTAL 3,298 3,212 3,150 2,943 N/A ,610 1,575 1,525 1,416 N/A ,908 4,787 4,675 4,359 N/A CSDDDECDSO Elementary Secondary TOTAL 5,417 5,924 6,452 6,323 N/A ,454 1,568 1,546 1,512 N/A ,871 7,492 7,998 7,835 N/A DIOCESE - WIDE Elementary Secondary TOTAL 44,600 N/A N/A 39,614 N/A -4, ,481 N/A N/A 21,562 N/A -1, ,081 N/A N/A 61,176 N/A -6, Note: Includes only data for deanery areas in the Diocese of London exept for the County of Norfolk Page 7-1
54 For all five boards, the trend line for both elementary and secondary panels is mostly a reduction in the number of students except for the French Catholic Board. The following trends are identified. For the Windsor Essex Catholic District School Board, the following is identified: From 2008 / 2009 to 2013 / 2014, the number of elementary students will decline from 16,339 to 12,800. This represents a decline of 3,539 students or 21.7%; For secondary school students, the 2008 / 2009 figures 8,556 students compared to the projected 8,100 students in 2013 / 2014, a decline of 456 students or 5.3%. For the total board, the student population will fall from 24,895 to 20,900, a decline of 3,995 students or 16.0%; In their projections report, they predict a stable student population after 2013 / For the St. Clair Catholic District School Board, the following pupil trend lines are identified: For the elementary students, the 2008 / 2009 figure was 7,184 students which will decline to 6,482 by 2013 and 6,478 by 2019 / This is a reduction of 702 students or 9.8%; For the secondary school students, 2008 / 2009 figure is 3,210 students, falling to 2,803 students in 2013 / 2014 and 2,556 students by 2019 / This is a decline of 407 secondary school students or 12.7%. For the board overall, the student population will fall from 10,394 in 2008 / 2009 to 9,285 in 2013 / 2014 and 9,034 in 2019 / This is a decline of 1,109 students or 10.7%. For the London Catholic District School Board, the following trend lines are identified: For elementary students, the 2008 / 2009 figure was 12,362 which will decline to 11,066 by 2013 / 2014 and 10,232 by 2019 / This represents a reduction of 1,296 elementary students or 10.5%; For secondary school students, 2008 / 2009 had a registration of 8,651 students which will decline to 7,731 in 2013 / 2014 and 10,232 in 2019 / This is a reduction of 1,296 students or 10.5%; Overall, for the London Board, 2008 / 2009 saw a registration of 21,113 students which is projected to be 18,797 students in 2013 / 2014 and 16,735 in 2019 / This is a drop of 2,616 students or 10.5% by 2013 / The following data was identified for the Huron-Perth Catholic District School Board: The elementary school student population is forecasted to decline by 345 students or 10.5% between 2008 / 2009 and 2013 / 2014; The secondary school population is forecasted to decline by 194 students or 12.4%; For the total school board, a reduction 539 students is forecasted or 11.0% by 2013 / Page 7-2
55 For the Conseil scolaire de district des ecoles catholiques du Sud-Ouest, covering only those areas within the diocese except for the County of Norfolk, the following trends are identified: An increase in student population of 906 at the elementary panel level or 16.7%; An increase in the secondary school panel student population of 58 students or 4.0%; A forecasted increase for the total board by 2013 / 2014 of 964 students or 14.2%. On diocese-wide basis, the following was identified for the Catholic School pupil populations: A reduction of nearly 5,000 elementary school students or 11.2% by 2013 / 2014; A reduction of just over 1,900 secondary school students or 18.2% by 2013 / 2014; A total Catholic School student pupil population reduction of approximately 6,900 or 10.1% by 2013 / The total Catholic School student population in 2008 / 2009 was 68,081 students. This forecasted to decrease to 61,176 by 2013 / Page 7-3

56 8 SUMMARY 8.1 CONSOLIDATED TRENDS GRAPHIC Figure 6 provides a line graph for all the major data elements to indicate, over variable time periods related to data availability, the key trend lines. What is identified, from a summary perspective, is simply that there is a significant downward trend for all the data areas. 8.2 KEY THEMES SUMMARY The following points summarize a number of the key themes that have emerged from the data assessments: Modest general population growth across the diocese with just about 35% of the population selfidentifying themselves as Catholics in the 2001 Census; A population that is aging significantly, particularly in rural areas, with most growth in urban centres; Page 8-1
57 Significant growth in immigrant and visible minority populations, and in common law and lone parent families; A relatively consistent decline in sacramental participation levels, particularly since 1993, with the declines ranging from 30% to 65% from 1993 to 2009; Funerals have declined 18.3% from 1975 to 2010,while burials in the larger Catholic Cemeteries in the Diocese increased 200% for 1975 to 2010; Some marginal decreases in average weekend mass attendance over the last three years for which data was available, with only the Ingersoll Deanery experiencing an increase; Of the 111 parishes within the weekend mass data, some 61% have experienced declines in average weekend mass attendance over the period. The reduction in attendance across the diocese was approximately 3.5%, ranging from a gain of.3% in the Ingersoll Deanery to a decline of 6% in the Essex Deanery; Consolidated parish collection revenues grew between1994 to 2001, but have declined since They have increased 15.9% between1994 to 2010 for Sunday Offertory Collections and 16.5% for Easter / Christmas Collections, with the growth primary prior to Parish priest availability will continue to decline, similar to the trend lines identified in the 1991 study. The current total of 100 parish specific priests will fall to seventy-seven by 2015, fifty-four by 2020 and forty-two by 2025, a decline of 58.0% if no replacements for non-diocesan priests are secured. If replacements are secured, total availability will be ninety-three in 2015, eighty-threefour by 2020 and seventy-three by 2025; Permanent Deacons represent 39individuals, of which approximately 5.2% are under the age fifty and 61.5% are over the age of sixty; There are seventy-six lay ecclesial ministers in parishes in 2011, of which 51.3% are under the age of fifty and 77.7% are female, including 85.7% of the coordinators of youth ministry; Based on the assumptions on graduation rates for deacons, there should be a steady rate of availability, moving from the current thirty-seven deacons in 2010 to potentially sixty by 2020; There is a direct relationship between the deanery locational profile for both permanent deacon and lay ecclesial ministry positions with population density, with London, Essex and Windsor having the highest levels of placement, over two-thirds of these positions; For pastoral ministers and coordinators of youth ministry, availability is influenced by other factors than for priests and deacons. These include the recruitment of people from various educational backgrounds, need, parish affordability, etc. Since 2006, there has been relative stability within the recruitment and attrition of both pastoral ministers, which was down four positions over the period, and coordinators of youth ministry, which has increased by three positions from 2006 and Catholic school board enrolment is forecasted to decline by 5,000 students or 11.2% at the elementary level and 1,900 students or 18.2% at the secondary level by 2013 / This Page 8-2
58 represents a total decline of 10.1% or 6,900 students over the 2010/2011 to 2015 / 2014 school years. The data indicates the continuing trends that have been identified for approximately twenty plus years in parish priest availability, mass attendance, sacramental activities, etc. These outcomes are influenced by a wide range of societal, Catholic community and related values and participation trends. From a strategic perspective, three analytical outcomes are identifiable from a broad pastoral and personnel planning perspective: The continuing forecasted decline of parish priest availability in the lowest availability scenario could be to levels that would see approximately one priest for every 2.5 existing parishes in the future, or one priests for every 1.4 parishes under Scenario B. The continuing aging of parish priests is also strongly identified. The implications this trend will have on how parishes are organized, led and supported in the future will need to be assessed; Evident downward transitions in sacramental activity levels that are influenced by a wide range of factors, ranging from lower birth rates, changing multi-cultural populations from Catholic to non- Christian countries, societal influences, religious institutional / structure affiliation and affinity, etc. All these factors will influence pastoral planning, parish configurations and personnel strategies if the trends continue, whether at marginal or substantive levels; Potential need for increased financial contributions from a declining church attendance base to cover aging buildings, growth in lay ecclesial ministers, on-going inflation and other costs. The continuing change perspectives that exist within the diocese s operating environment are significant and will need critical attention, understanding and effective planning as the environment continues to evolve. As a result, new strategies and perspectives will likely need to be considered, evaluated, tested and then potentially implemented as appropriate to meet both the opportunities and needs of the Diocese of London Catholic Community in the future. Page 8-3
59 APPENDIX I Selected Base Line Diocesan Collected Data
60 #1 - ESSEX DEANERY (700) Priests in Parish Ministry Year Parishes Missions/Churches/ DOLincardinated Religious Non-Incardinated Total Priests Priests Designated Permanent Lay Ecclesial Parish Support Catholic Communities Priests Priests Priests in DOL in Parish Ministry Ministries * Deacons Ministers Staff #2 - WINDSOR DEANERY (600) Priests in Parish Ministry Year Parishes Missions/Churches/ DOLincardinated Religious Non-Incardinated Total Priests Priests Designated Permanent Lay Ecclesial Parish Support Catholic Communities Priests Priests Priests in DOL in Parish Ministry Ministries Deacons Ministers Staff # 3 - KENT DEANERY (500) Priests in Parish Ministry Year Parishes Missions/Churches/ DOLincardinated Religious Non-Incardinated Total Priests Priests Designated Permanent Lay Ecclesial Parish Support Catholic Communities Priests Priests Priests in DOL in Parish Ministry Ministries Deacons Ministers Staff #4 - HURON-PERTH DEANERY - (300) (note until 1990 Huron-Perth Deanery known as Stratford Deanery) Priests in Parish Ministry Year Parishes Missions/Churches/ DOL Religious Non-Incardinated Total Priests Priests Designated Permanent Lay Ecclesial Parish Support Catholic Communities Priests Priests Priests in DOL in Parish Ministry Ministries Deacons Ministers Staff
61 # 5 - SARNIA DEANERY (400) Priests in Parish Ministry Year Parishes Missions/Churches/ DOLincardinated Religious Non-Incardinated Total Priests Priests Designated Permanent Lay Ecclesial Parish Support Catholic Communities Priests Priests Priests in DOL in Parish Ministry Ministries Deacons Ministers Staff # 6 - LONDON DEANERY (100) Priests in Parish Ministry Year Parishes Missions/Churches/ DOLincardinated Religious Non-Incardinated Priests Designated Permanent Lay Ecclesial Parish Support Catholic Communities Priests Priests Priests in DOL Ministries Deacons Ministers Staff # 7 - INGERSOLL DEANERY (200) Priests in Parish Ministry Year Parishes Missions/Churches/ DOLincardinated Religious Non-Incardinated Total Priests Priests Designated Permanent Lay Ecclesial Parish Support Catholic Communities Priests Priests Priests in DOL in Parish Ministry Ministries Deacons Ministers Staff # Historical Summation - Statisticial Analysis of Parish Ministry Personnel Priests in Parish Ministry Year Parishes Missions/Churches/ DOLincardinated Religious Non-Incardinated Total Priests Priests Designated Permanent Lay Ecclesial Parish Support Catholic Communities Priests Priests Priests in DOL in Parish Ministry Ministries Deacons Ministers Staff Notes: #1 Grey shaded areas indicate no complete data avaialble prior to 1995 #2 Priests in Designated Ministries represent only Diocese of London priests incardinated who serve in: Diocesan administration, hospital ministry, academic institutions, St. Peter's Seminary, Regina Mundi College, King's College, social service agencies, renewal centres, retreat house #3 The priest statistics do not include Diocese of London incardinated priests who are on leave of absences or serving in ministry outside the Diocese #4 Permanent Deacons represent incardinated and non-incardinated permanent deacons assigned to parish ministry. This includes four (4) non-incardinated permanent deacons assigned to parish ministry #5 Parish Support Staff represent all full time and part-time business support, custodial support and housekeeping support employed in the diocese
62 APPENDIX II Pastoral Plan for the Diocese of London

63 E mbracing a Future Full of Hope A Pastoral Plan for the Diocese of London For surely I know the plans I have for you, says the Lord, plans for your welfare and not for harm, to give you a future with hope. (Jeremiah 29:11) Preamble: Called by Jesus through baptism into his passion, death and resurrection and anointed by the Spirit, we, the people of God in the Diocese of London, are to be living signs of Christ s presence in the world today. United in Christ, the Bread of Life, we commit ourselves to carrying out the mission of proclaiming the coming of the kingdom of God in our time. We embrace the Gospel believing what we read, preaching what we believe, and practicing what we preach. As a people of faith, trusting in the Spirit who leads us, we dedicate ourselves to the following goals; Goal I As living signs of Christ s presence, we will respond to the call to personal holiness given to all by committing ourselves to opportunities for ongoing conversion and spiritual renewal. Goal II Called by Christ, we will evangelize through the clear proclamation of the Gospel and the constant teaching of the Catholic faith, assuring that such proclamation and teaching is linked to the life experience of the people. Goal III With our sights set on the mission of Jesus, we will minister with justice and compassion to the wounded, the searching, the entrapped and those in material and spiritual need. Goal IV As the Body of Christ, formed by word and sacrament, we will make provision for meaningful liturgical celebrations in our parish communities to ensure full, conscious and active participation by all. Goal V Inviting all to co-responsible ministry, we will encourage and support the ongoing formation of laity, religious and ordained. Goal VI Imitating Christ the servant-leader, we will employ and model governance practices at all levels that seek to: meet the needs of God s people, support the Church s mission, ensure appropriate participation in decision-making by the laity, religious and ordained, uphold Gospel stewardship, and promote accountability and transparency. Promulgated at St. Peter s Cathedral Basilica in London, Ontario on May 30, 2004, the Solemnity of Pentecost Most Rev. Ronald Fabbro, C.S.B. Bishop of London /07
64 APPENDIX III Letter From Bishop Fabbro and Synopsis of Report, for Inclusion in Parish Bulletins September 17-18, 2011

65 Trends Impacting Pastoral & Personnel Planning in the Diocese of London September 15, 2011 Dear sisters and brothers in Christ, Last fall, the diocese commissioned a report that would present data, projections and analysis on the future availability of parish priests, on Sunday Mass attendance, and on demographic, sacramental, financial and other personnel data. Mr. Fred Galloway, a planning consultant who assisted us in the past, prepared the report. The brief synopsis below will give you an overview of the report s findings in a format which I hope is easy to read and understand. The full 65-page report is available online at The report provides current trends and projections which speak to changes in society and the ways people live out their faith in everyday life. I found this report hard to read. Many of us are saddened by the losses our Church has experienced in our own lifetime. I think it is important to emphasize, then, that the report should not be a source of discouragement for us. It is a tool that gives us solid data which can help us understand the rapid changes we have witnessed. Most Rev. Ronald P. Fabbro, csb Bishop of London Our people are aware of the pressing realities that our Church is facing. When I do pastoral visits, they have spoken to me about the challenges they face and the need to make changes, so that our diocese can move forward with renewed hope. They know that it is well within our reach to make these changes. Our Holy Father, Pope Benedict XVI, refers to the challenges that our Church is facing in the context of the new evangelization, that is, our mission to bring the Gospel to our world, to bear witness, by our words and actions, to Jesus love for us. The period of spiritual renewal which our diocese has begun, and programs such as Arise Together in Christ, will better prepare us for this mission and enable us to address the work before us. What we need to do now is study the report carefully. Through prayerful discernment, we will be able to develop sound pastoral strategies for the future. All of us clergy and laity, young and old need to be working together. In the weeks ahead, I will be turning to you and seeking your input and support. It is in this spirit, that I ask you to read the synopsis that follows. TRENDS IN CANADIAN SOCIETY... Population Canada is experiencing an aging population driven by the Boomer generation (about a third of all Canadians). Rural population is decreasing in some areas up to 2% a year as the population ages and younger people leave for post-secondary education and/ or employment and farm consolidation continues. The birth rate in Canada has declined to the point that natural population replacement is not achievable. Canada requires 250,000 to 300,000 new immigrants each year to sustain our population. Historically, new immigrants mostly came from northern and eastern Europe. Today, immigrants are arriving from Africa, South America and the Middle and Far East, primarily non- Catholic areas except for South America. Technology Technology growth involves communications, operations, delivery techniques, accountability, and many other areas. Social media have become increasingly important. Many people under 35 years of age do not read newspapers or use landline telephones. They rely on the internet using social networks such as Facebook, Twitter, and apps to receive information and to communicate. Organizations that fail to respond to these trends will be increasingly marginalized by younger generations who, as they age, will become the dominant population group. Globalization For young people especially, the whole world is accessible, and their view of the world extends well beyond their local communities. This much broader perspective impacts their values, perception of what is important and understanding of where and how they belong. People s Connection with the Church Another emerging trend is the reduced affinity people have with traditional
66 institutions, suppliers and others. This is particularly evident among younger generations. This decline in institutional affinity impacts most Christian churches given perceptions of reduced relevancy, new forms of communication, education, changing societal values and globalization. For many people, spirituality is seen and practiced quite separately from traditional church structures. The sexual abuse of children by priests has also led to a loss of trust in the moral authority of the Church. Volunteerism Volunteerism has long been a cornerstone for services provided by parishes. In recent years, many people have less time and willingness to volunteer on a long-term basis, given the hectic and fragmented nature of modern life. Across Canadian society, increased scrutiny, expectations and police checks associated with volunteering impact people s willingness to get involved. TRENDS IN THE DIOCESE OF LONDON... Sacramental, Mass Attendance, Finance & Other Trends For more than 30 years, data has been collected regarding Sacraments. For the past three years, average weekend Mass attendance counts have been taken at all parishes. The Sacramental data shows constantly declining levels of participation. For most Sacraments, this began most evidently after Some, but not all, of the reductions involve pre-school and school-age Sacraments (Baptism, First Communion and Confirmation) which can be associated with declining birth rates and student populations in Catholic schools, particularly in rural areas. Numbers of marriages show the most significant decline. Also funerals in churches have declined 18% from 1975 to 2010, though burials in larger Catholic cemeteries increased 200% for the same period. Sunday Mass attendance is lower as well. The reduction across the diocese over the past three years was approximately 3.5%, ranging from a slight increase in the Ingersoll area to a 6% decline in Essex County. Catholics represent about a third of the general population in southwestern Ontario. Based on approximately 450,000 Catholics living in the Diocese of London, average weekend Mass attendance is around 14%. There are 120 parishes and Catholic communities in the diocese in 2010 compared to 171 in This reduction primarily results from parish reorganization over the last ten years. Regarding parish finances, since 1994 the Sunday offertory revenues have increased 15.9%, which is slightly less than cumulative inflation over the same period. Almost all of this growth occurred before Priests Available for Parish Ministry Parish priest availability has also been examined. Projections were first completed in We now have new projections based on significantly more data regarding age, retirement and other factors. In 1991, there were 178 priests available for parish ministry in the Diocese of London. Currently 100 priests serve in parishes. Taking into account retirements, sabbaticals, new religious and international priests, and ordinations forecasted at about 1.7 diocesan priests per year, by 2025 there will be 73 parish priests, nearly half of whom would be priests from outside North America. Deacons Availability The number of permanent deacons in the diocese has increased from two in 1995 to 38 in By 2021, 72 permanent deacons are projected to be available. Lay Ecclesial Ministers The number of Lay Ecclesial Ministers has increased from nine to 78 individuals since Their average age is 50 and nearly 80% are female. Parish Support Staff Since 1995, the Parish support staff have increased from 462 to 513 individuals. Catholic School Student Projections Six Catholic school boards serve within the diocese: Windsor-Essex, St. Clair, London, Huron-Perth and Counseil Scolaire Ecoles des District des Ecoles catholique du Sud-Ouest. As well, a small portion of Brant Haldimand Norfolk Catholic District School Board lies in the diocese. The total Catholic school student population for the five main boards in was 68,081. This is forecasted to decrease by approximately 10% by ANALYSIS... From a strategic perspective, at least two analytical outcomes emerge: If current trends and strategies continue, by 2025 there will be just one priest for every two or three parishes, and the average age of these priests would be older. The implications of these trends on how parishes are organized, led and supported in the future will need to be assessed. Less people are Catholic, and less people who self-identify as Catholic practice their faith by participating in the Sacraments. This downward trend in our diocese is influenced by a wide range of factors, including declining birth rates, changing multicultural populations, societal influences, loss of religious affinity, and changing faith practices etc. All of these factors must be taken into account in our pastoral and personnel planning. See the next page to read about how we are moving forward.


67 Moving Forward The above synopsis provides a brief glimpse of the wealth of information contained in the report. It is apparent that we cannot continue operating as we are now. We must make strategic changes that will best position our diocese for the future. We must start to plan for these changes immediately. As I stated above, all of us need to be engaged in developing these strategic plans. In the months ahead, I will be seeking input from our people, especially our diocesan leaders. The following meetings have already been scheduled: October 2011: I will meet with the Episcopal Vicars and Directors, Deanery Chairs, Rector of St. Peter s Seminary, Director of the Institute for Catholic Formation and diocesan leaders to design the process and time line for consultation and next steps. November 2011: I will meet with all priests, deacons and lay ecclesial ministers. Spring 2012: There will be various opportunities for input by the people of the diocese. We have already begun to develop a personnel plan for priests, deacons and lay ecclesial ministers. This plan will address short-term, pressing needs, while holding a longer-term vision of how the diocese will provide for and support competent servant leaders who will respond faithfully and effectively to emerging pastoral needs in the future. It is my hope that we can begin to enact changes in June I am interested in your thoughts about the report and our plans. I invite you to send me an or letter, or to contact me through the different social media, including Facebook, Twitter and YouTube. The challenges before us are huge. We need to be courageous in addressing them, so that we can more effectively carry on the mission of evangelization which Jesus has entrusted to us. It is my prayer that each of us will personally encounter him in our daily lives. The experience of meeting him and of opening our hearts to him enables us to embrace a future full of hope, the central theme of our Diocesan Pastoral Plan. Sincerely yours in Christ, Most Rev. Ronald P. Fabbro, C.S.B. Bishop of London 1070 Waterloo Street London, ON N6A 3Y2 info@dol.ca This is a synopsis of the Pastoral and Personnel Planning Statistical Projections & Analysis Report, prepared in September 2011 by F.J. Galloway Associates Inc. The full report is available at
August Parish Life Survey. Saint Benedict Parish Johnstown, Pennsylvania
 August 2018 Parish Life Survey Saint Benedict Parish Johnstown, Pennsylvania Center for Applied Research in the Apostolate Georgetown University Washington, DC Parish Life Survey Saint Benedict Parish
The best estimate places the number of Catholics in the Diocese of Trenton between 673,510 and 773,998.
 Number of Catholics Living in the Diocese of Trenton It is impossible to verify how many individual Catholics reside in the Diocese of Trenton. Not all are registered in parishes, and the U.S. Census does
Mind the Gap: measuring religiosity in Ireland
 Mind the Gap: measuring religiosity in Ireland At Census 2002, just over 88% of people in the Republic of Ireland declared themselves to be Catholic when asked their religion. This was a slight decrease
January Parish Life Survey. Saint Paul Parish Macomb, Illinois
 January 2018 Parish Life Survey Saint Paul Parish Macomb, Illinois Center for Applied Research in the Apostolate Georgetown University Washington, DC Parish Life Survey Saint Paul Parish Macomb, Illinois
Strategic Plan. St. Peter s Cathedral Basilica Parish. June F. J. Galloway Associates Inc. 6/25/2014 Version 3.0
 Basilica Parish June 2014 F. J. Galloway Associates Inc. 6/25/2014 Version 3.0 Table of Contents 1 Introduction... 1 2 What We Value And Our Vision... 2 2.1 What We Value... 2 2.2 Vision... 2 3 Mission
May Parish Life Survey. St. Mary of the Knobs Floyds Knobs, Indiana
 May 2013 Parish Life Survey St. Mary of the Knobs Floyds Knobs, Indiana Center for Applied Research in the Apostolate Georgetown University Washington, DC Parish Life Survey St. Mary of the Knobs Floyds
Holy Family Catholic Church Key Findings Report
 Holy Family Catholic Church Key Findings Report Toward a Strategic Plan INTRODUCTION 1 I. PARISH VISION AND ORGANIZATION FOR MISSION 3 A. TOWARD A VISION STATEMENT 3 B. PASTORAL STAFF 13 C. LAY LEADERSHIP,
Building Up the Body of Christ: Parish Planning in the Archdiocese of Baltimore
 Building Up the Body of Christ: Parish Planning in the Archdiocese of Baltimore And he gave some as apostles, others as prophets, others as evangelists, others as pastors and teachers, to equip the holy
American Parishes in the Twenty-First Century
 The Australasian Catholic Record, Volume 92 Issue 2 (April 2015) 197 American Parishes in the Twenty-First Century Mary L. Gautier* It is exciting to be witness to the twenty-first century in American
Strategic Planning Update for the Diocese of Evansville
 Strategic Planning Update for the Diocese of Evansville November 2012 2 The following Q&A features the latest information about the strategic planning initiative currently underway in our diocese. This
Working Paper Anglican Church of Canada Statistics
 Working Paper Anglican Church of Canada Statistics Brian Clarke & Stuart Macdonald Introduction Denominational statistics are an important source of data that keeps track of various forms of religious
Congregational Survey Results 2016
 Congregational Survey Results 2016 1 EXECUTIVE SUMMARY Making Steady Progress Toward Our Mission Over the past four years, UUCA has undergone a significant period of transition with three different Senior
Driven to disaffection:
 Driven to disaffection: Religious Independents in Northern Ireland By Ian McAllister One of the most important changes that has occurred in Northern Ireland society over the past three decades has been
America s Changing Religious Landscape
 Religion & Public Life America s Changing Religious Landscape Christians Decline Sharply as Share of Population; Unaffiliated and Other Faiths Continue to Grow The Christian share of the U.S. population
Does your church know its neighbours?
 Does your church know its neighbours? A Community Opportunity Scan will help a church experience God at work in the community and discover how it might join Him. Is your church involved in loving its neighbours?
NCLS Occasional Paper Church Attendance Estimates
 NCLS Occasional Paper 3 2001 Church Attendance Estimates John Bellamy and Keith Castle February 2004 2001 Church Attendance Estimates John Bellamy and Keith Castle February 2004 Introduction The National
Center for Applied Research in the Apostolate
 Special Report: Parish Life Today About CARA CARA is a national, non-profit, Georgetown University affiliated research center that conducts social scientific studies about the Catholic Church. Founded
State of Catholicism Introduction Report. by Jong Han, Religio Head of Research Peter Cetale, Religio CEO
 State of Catholicism 2018 Introduction Report by Jong Han, Religio Head of Research Peter Cetale, Religio CEO Purpose To inform on the overall state of Catholicism and the Catholic church in the United
A Comprehensive Study of The Frum Community of Greater Montreal
 A Comprehensive Study of The Frum Community of Greater Montreal The following is a comprehensive study of the Frum Community residing in the Greater Montreal Metropolitan Area. It was designed to examine
Working Paper Presbyterian Church in Canada Statistics
 Working Paper Presbyterian Church in Canada Statistics Brian Clarke & Stuart Macdonald Introduction Denominational statistics are an important source of data that keeps track of various forms of religious
Church Leader Survey. Source of Data
 Hope Channel Church Leader Survey Center for Creative Ministry June 2014 Source of Data An Email request was sent to the officers of fthe union conferences and union missions, and the members of the General
UK to global mission: what really is going on? A Strategic Review for Global Connections
 UK to global mission: what really is going on? A Strategic Review for Global Connections Updated summary of seminar presentations to Global Connections Conference - Mission in Times of Uncertainty by Paul
Studies of Religion. Changing patterns of religious adherence in Australia
 Studies of Religion Changing patterns of religious adherence in Australia After the Second World War thousands of migrants gained assisted passage each year and most settled in urban areas of NSW and Victoria.
Resolution Related to a Comprehensive Urban Ministry Strategic Plan
 Resolution Related to a Comprehensive Urban Ministry Strategic Plan Submitted by: Commission on Urban Ministry Presenters: Robin Hynicka and Lydia Munoz Whereas, the Commission on Urban Ministry is charged
Cathedral Statistics 2016
 Cathedral Statistics 2016 Research and Statistics Church House Great Smith Street London SW1P 3AZ Tel: 020 7898 1547 Published 2017 by Research and Statistics. Copyright Research and Statistics 2017 All
Religio. State of Catholicism. Introduction Report
 Religio State of Catholicism Introduction Report By Jong Han Head of Research Religio Purpose: To inform on the overall state of Catholicism and the Catholic church in the United States through generational
Britain s Jewish Community Statistics 2010
 Britain s Jewish Community Statistics 2010 Daniel Vulkan Board of Deputies of British Jews April 2012 Contents Executive summary... 3 Introduction... 5 Births... 6 Marriages... 9 Divorces... 13 Deaths...
East Bay Jewish Community Study 2011
 East Bay Jewish Community Study 2011 Demographic Survey Executive Summary Facilitated by Greenberg Quinlan Rosner Research Executive Summary The Jewish Community of the East Bay is imbued with a rich array
The Church in Wales. Membership and Finances 2015
 The Church in Wales Membership and Finances 215 Welcome to the Church in Wales Membership and Finances report for 215. This year s report is based upon a 94% return from Church in Wales parishes. We are
Summary Christians in the Netherlands
 Summary Christians in the Netherlands Church participation and Christian belief Joep de Hart Pepijn van Houwelingen Original title: Christenen in Nederland 978 90 377 0894 3 The Netherlands Institute for
THERE is an obvious need for accurate data on the trend in the number of. in the Republic of Ireland, BRENDAN M. WALSH*
 Trends in the Religious in the Republic of Ireland, Composition of the Population BRENDAN M. WALSH* Abstract: Compared with 1946 there were more Catholics in the Republic in 1971 but 24 per cent fewer
Working Group 3 ODS 18.10
 Working Group 3 ODS 18.10 Background Paper for Diocesan Synod Nov 2018 As part of the Common Vision Programme, Working Group 3 was asked to come up with some highly ambitious goals and a plan to deliver
April Parish Life Survey. Saint Elizabeth Ann Seton Parish Las Vegas, Nevada
 April 2017 Parish Life Survey Saint Elizabeth Ann Seton Parish Las Vegas, Nevada Center for Applied Research in the Apostolate Georgetown University Washington, DC Parish Life Survey Saint Elizabeth Ann
COMPASSIONATE SERVICE, INTELLIGENT FAITH AND GODLY WORSHIP
 COMPASSIONATE SERVICE, INTELLIGENT FAITH AND GODLY WORSHIP OUR VISION An Anglican community committed to proclaiming and embodying Jesus Christ through compassionate service, intelligent faith and Godly
Transition Summary and Vital Leader Profile. The Church Assessment Tool 5/3/16
 Transition Summary and Vital Leader Profile generated from The Church Assessment Tool 5/3/16 "And this is my prayer: that your love may abound more and more in knowledge and depth of insight, so that you
State of Christianity
 State of Christianity 2018 Introduction Report by Jong Han, Religio Head of Research Peter Cetale, Religio CEO Purpose To inform on the overall state of Christianity and the churches in the United States
An Update on Resourcing Ministerial Education, and Increases in Vocations and Lay Ministries
 GS Misc 1190 An Update on Resourcing Ministerial Education, and Increases in Vocations and Lay Ministries Key Points The number of ordinands entering training grew by 14% between 2016 and 2017, with a
A study on the changing population structure in Nagaland
 A study on the changing population structure in Nagaland Y. Temjenzulu Jamir* Department of Economics, Nagaland University, Lumami. Pin-798627, Nagaland, India ABSTRACT This paper reviews the changing
Christians Say They Do Best At Relationships, Worst In Bible Knowledge
 June 14, 2005 Christians Say They Do Best At Relationships, Worst In Bible Knowledge (Ventura, CA) - Nine out of ten adults contend that their faith is very important in their life, and three out of every
St. Anselm Church 2017 Community Life Survey Results
 St. Anselm Church 2017 Community Life Survey Results INTRODUCTION This report summarizes the responses and commentary of individuals and families who responded to our 2017 St. Anselm Community Life Survey.
The Future has Arrived: Changing Theological Education in a Changed World
 The Future has Arrived: Changing Theological Education in a Changed World Session 2 The Future has arrived. I know that statement doesn t make much sense; the future is always arriving, isn t it? It is
South-Central Westchester Sound Shore Communities River Towns North-Central and Northwestern Westchester
 CHAPTER 9 WESTCHESTER South-Central Westchester Sound Shore Communities River Towns North-Central and Northwestern Westchester WESTCHESTER 342 WESTCHESTER 343 Exhibit 42: Westchester: Population and Household
HOLY TOLL: THE IMPACT OF THE RECESSION ON US ORTHODOX CHRISTIAN CHURCHES
 ALEXEI D. KRINDATCH (AKRINDATCH@AOL.COM), RESEARCH COORDINATOR ASSEMBLY OF CANONICAL ORTHODOX BISHOPS IN NORTH AND CENTRAL AMERICA HOLY TOLL: THE IMPACT OF THE 2008 2009 RECESSION ON US ORTHODOX CHRISTIAN
UUA Strategic Plan. Our Strategic Vision and the FY 2014 Budget. April, 2013
 UUA Strategic Plan Our Strategic Vision and the FY 2014 Budget April, 2013 Introduction Our shared vision the Ends of the Association Our shared vision is an image of a religious people who are deeply
A Survey of Christian Education and Formation Leaders Serving Episcopal Churches
 A Survey of Christian Education and Formation Leaders Serving Episcopal Churches Summarized by C. Kirk Hadaway, Director of Research, DFMS In the late fall of 2004 and spring of 2005 a survey developed
St. Peter s Cathedral Basilica Parish. Environmental Scan. Strategic Plan 2014
 St. Peter s Cathedral Basilica Parish Strategic Plan 2014 F. J. GALLOWAY ASSOCIATES INC. 1/1/2014 Table of Contents 1 INTRODUCTION... 1 1 2 PARISH PROFILE... 2 1 2.1 INTRODUCTION... 2 1 2.2 PASTORAL PLAN...
SAINT ANNE PARISH. Parish Survey Results
 SAINT ANNE PARISH Parish Survey Results Stewardship Committee 3/1/2015 Executive Summary Survey Representation Based on counts made during the months of May and September, 2014, the average number of adults
Executive Summary Clergy Questionnaire Report 2015 Compensation
 45 th Anniversary of the Ordination of Women Executive Summary Clergy Questionnaire Report 2015 Research and Evaluation, Office of the Presiding Bishop Evangelical Lutheran Church in America Kenneth W.
The Fifth National Survey of Religion and Politics: A Baseline for the 2008 Presidential Election. John C. Green
 The Fifth National Survey of Religion and Politics: A Baseline for the 2008 Presidential Election John C. Green Ray C. Bliss Institute of Applied Politics University of Akron (Email: green@uakron.edu;
Changes in the Ethnic Diversity of the Christian Population in England
 National Census 2001 and 2011 Changes in the Ethnic Diversity of the Christian Population in England between 2001 and 2011 South West Region Council for Christian Unity 2014 CONTENTS Foreword from the
By world standards, the United States is a highly religious. 1 Introduction
 1 Introduction By world standards, the United States is a highly religious country. Almost all Americans say they believe in God, a majority say they pray every day, and a quarter say they attend religious
BAPTIST ASSOCIATIONS
 THE STATE OF BAPTIST ASSOCIATIONS PERCEPTIONS, PARTNERSHIPS, AND PATHWAYS FORWARD A REPORT PRODUCED BY JASON LOWE DIRECTOR OF MISSIONS PIKE ASSOCIATION OF SOUTHERN BAPTISTS Copyright 2017 by Jason Lowe.
NCLS Occasional Paper 8. Inflow and Outflow Between Denominations: 1991 to 2001
 NCLS Occasional Paper 8 Inflow and Outflow Between Denominations: 1991 to 2001 Sam Sterland, Ruth Powell and Keith Castle March 2006 The National Church Life Survey The National Church Life Survey has
Treatment of Muslims in Broader Society
 Treatment of Muslims in Broader Society How Muslims are treated in Canada Muslims are a bit more positive than in 200 about how they are viewed by mainstream society, and most agree they are better off
COMMUNITY FORUM CONVERSATIONS. Facilitation Guide
 COMMUNITY FORUM CONVERSATIONS Facilitation Guide In the twenty-first century, Jewish community life is changing in ways both large and small. At the same time, we believe we share an enduring aspiration
NATIONAL HOUSEHOLD SURVEY
 NATIONAL HOUSEHOLD SURVEY THE JEWISH COMMUNITY OF MONTREAL PART 7 THE SEPHARDIC COMMUNITY BY CHARLES SHAHAR APRIL 2015 2011 National Household Survey Analysis Part 7 The Sephardic Community By Charles
JEWISH EDUCATIONAL BACKGROUND: TRENDS AND VARIATIONS AMONG TODAY S JEWISH ADULTS
 JEWISH EDUCATIONAL BACKGROUND: TRENDS AND VARIATIONS AMONG TODAY S JEWISH ADULTS Steven M. Cohen The Hebrew University of Jerusalem Senior Research Consultant, UJC United Jewish Communities Report Series
Struggle between extreme and moderate Islam
 EXTREMISM AND DOMESTIC TERRORISM Struggle between extreme and moderate Islam Over half of Canadians believe there is a struggle in Canada between moderate Muslims and extremist Muslims. Fewer than half
Fourth Synod of the Diocese of Bridgeport. Synodal Summary
 Fourth Synod of the Diocese of Bridgeport Synodal Summary September 19, 2015 Introduction On Friday, September 19, 2014, Bishop Frank Caggiano signed the official decree opening the Fourth Diocesan Synod
Priests of the Archdiocese of Chicago: Moving into a New Century with Hope and Vision
 Center for Applied Research in the Apostolate Summary. Georgetown University Report. Washington, D.C. Serving Dioceses, Parishes and Religious Communities Since 1964 Spring 2000 Priests of the Archdiocese
Treatment of Muslims in Canada relative to other countries
 TREATMENT OF MUSLIMS IN CANADA Treatment of Muslims in Canada relative to other countries Most Canadians feel Muslims are treated better in Canada than in other Western countries. An even higher proportion
A Socio-economic Profile of Ireland s Fishing Harbours. Greencastle
 A Socio-economic Profile of Ireland s Fishing Harbours Greencastle A report commissioned by BIM Trutz Haase* and Feline Engling May 2013 *Trutz-Hasse Social & Economic Consultants www.trutzhasse.eu +353
What happened to the Christians of Andhra Pradesh
 What happened to the Christians of Andhra Pradesh There have been often doubts about the number of Christians counted in the Indian Censuses. It is speculated that a large number of Christian converts
A STUDY OF RUSSIAN JEWS AND THEIR ATTITUDES TOWARDS OVERNIGHT JEWISH SUMMER CAMP. Commentary by Abby Knopp
 A STUDY OF RUSSIAN JEWS AND THEIR ATTITUDES TOWARDS OVERNIGHT JEWISH SUMMER CAMP Commentary by Abby Knopp WHAT DO RUSSIAN JEWS THINK ABOUT OVERNIGHT JEWISH SUMMER CAMP? Towards the middle of 2010, it felt
Westminster Presbyterian Church Discernment Process TEAM B
 Westminster Presbyterian Church Discernment Process TEAM B Mission Start Building and document a Congregational Profile and its Strengths which considers: Total Membership Sunday Worshippers Congregational
ABOUT THE STUDY Study Goals
 ABOUT THE STUDY ABOUT THE STUDY 2014 Study Goals 1. Provide a database to inform policy and planning decisions in the St. Louis Jewish community. 2. Estimate the number of Jewish persons and Jewish households
ATTACHMENT (D) Presbytery of New Harmony Evaluation & Long Range Planning Committee Update Report to the Stated Meeting of Presbytery October 10, 2017
 Presbytery of New Harmony Evaluation & Long Range Planning Committee Update Report to the Stated Meeting of Presbytery October 10, 2017") Presbytery of New Harmony Evaluation & Long Range Planning Committee Update Report to the Stated Meeting of Presbytery October 10, 2017 Recent events in the life of our denomination have presented us with
Presbytery of New Harmony Evaluation & Long Range Planning Committee Update Report to the Stated Meeting of Presbytery October 10, 2017 Recent events in the life of our denomination have presented us with
Pray, Equip, Share Jesus:
 Pray, Equip, Share Jesus: 2015 Canadian Church Planting Survey Research performed by LifeWay Research 1 Preface Issachar. It s one of the lesser known names in the scriptures. Of specific interest for
Luther Seminary Strategic Plan
 Luther Seminary Strategic Plan 2016-2019 Mission Luther Seminary educates leaders for Christian communities, called and sent by the Holy Spirit, to witness to salvation in Jesus Christ, and to serve in
Evaluation Report. September 30, Author/Researcher Taylor Billings, Research Specialist. Editor Kristina Lizardy-Hajbi, Director
 Evaluation Report September 30, 2013 Author/Researcher Taylor Billings, Research Specialist Editor Kristina Lizardy-Hajbi, Director Center for Analytics, Research and Data (CARD) United Church of Christ
Survey Report New Hope Church: Attitudes and Opinions of the People in the Pews
 Survey Report New Hope Church: Attitudes and Opinions of the People in the Pews By Monte Sahlin May 2007 Introduction A survey of attenders at New Hope Church was conducted early in 2007 at the request
Changes in the Ethnic Diversity of the Christian Population in England
 National Census 2001 and 2011 Changes in the Ethnic Diversity of the Christian Population in England between 2001 and 2011 West Midlands Region Council for Christian Unity 2014 CONTENTS Foreword from the
Young Adult Catholics This report was designed by the Center for Applied Research in the Apostolate (CARA) at Georgetown University for the
 at Georgetown University for the") Center Special for Applied Research in the Apostolate. Report Georgetown University. Washington, D.C. Serving Dioceses, Parishes, and Religious Communities Since 196 Fall 2002 Young Adult Catholics This
Center Special for Applied Research in the Apostolate. Report Georgetown University. Washington, D.C. Serving Dioceses, Parishes, and Religious Communities Since 196 Fall 2002 Young Adult Catholics This
Evening Prayer. Liturgy of the Hours
 Evening Prayer Liturgy of the Hours Saint Thomas Church Stewards for Tomorrow Pastoral Planning Archdiocese of Hartford Suburban Waterbury Deanery July 12, 2016 Our Call to Unity and Action Parish and
Appendix 1. Towers Watson Report. UMC Call to Action Vital Congregations Research Project Findings Report for Steering Team
 Appendix 1 1 Towers Watson Report UMC Call to Action Vital Congregations Research Project Findings Report for Steering Team CALL TO ACTION, page 45 of 248 UMC Call to Action: Vital Congregations Research
Anthony Stevens-Arroyo On Hispanic Christians in the U.S.
 Anthony Stevens-Arroyo On Hispanic Christians in the U.S. By Tracy Schier Anthony Stevens-Arroyo is professor of Puerto Rican and Latino Studies at Brooklyn College and Distinguished Scholar of the City
The changing religious profile of Asia: Buddhists, Hindus and Chinese Religionists
 The changing religious profile of Asia: Buddhists, Hindus and Chinese Religionists We have described the changing share and distribution of Christians and Muslims in different parts of Asia in our previous
Statutory Inspection of Anglican and Methodist Schools (SIAMS) The Evaluation Schedule for the Statutory Inspection of Anglican and Methodist Schools
 The Evaluation Schedule for the Statutory Inspection of Anglican and Methodist Schools") Statutory Inspection of Anglican and Methodist Schools (SIAMS) The Evaluation Schedule for the Statutory Inspection of Anglican and Methodist Schools Revised version September 2013 Contents Introduction
Statutory Inspection of Anglican and Methodist Schools (SIAMS) The Evaluation Schedule for the Statutory Inspection of Anglican and Methodist Schools Revised version September 2013 Contents Introduction
Summer Revised Fall 2012 & 2013 (Revisions in italics)
") Long Range Plan Summer 2011 Revised Fall 2012 & 2013 (Revisions in italics) St. Raphael the Archangel Parish is a diverse community of Catholic believers called by baptism to share in the Christian mission
Long Range Plan Summer 2011 Revised Fall 2012 & 2013 (Revisions in italics) St. Raphael the Archangel Parish is a diverse community of Catholic believers called by baptism to share in the Christian mission
The United Methodist Church A Call to Action Disciple making and world transformation occurs through vital congregations A vital congregation has
 The United Methodist Church Making disciples of Jesus Christ for the transformation of the world Matthew 28:18-20 The Great Commission and Matthew 22:36-40 The Great Commandment A Call to Action The United
INTRODUCTION. Vital-ARe-We-4.pdf, or by ing
 INTRODUCTION FACTS about Local and Global Mission Programs and Giving A Report of UCC Results from the FACT Study Marjorie H. Royle, Ph.D. Clay Pots Research November, 2011 This report is one in a series
Presbytery of New Harmony Evaluation & Long Range Planning Committee Update Report to the Stated Meeting of Presbytery May 9, 2017
 Presbytery of New Harmony Evaluation & Long Range Planning Committee Update Report to the Stated Meeting of Presbytery May 9, 2017 Recent events in the life of our denomination have presented us with exciting
FACTS About Non-Seminary-Trained Pastors Marjorie H. Royle, Ph.D. Clay Pots Research April, 2011
 FACTS About Non-Seminary-Trained Pastors Marjorie H. Royle, Ph.D. Clay Pots Research April, 2011 This report is one of a series summarizing the findings of two major interdenominational and interfaith
2012 UMC Vital Congregations Planning Guide
 2012 UMC Vital Congregations Planning Guide A Strategic Plan for United Methodist Congregations To Fulfill the Mission of The United Methodist Church -- New York Annual Conference Introduction The United
Faith Formation 2020 Envisioning Dynamic, Engaging and Inspiring Faith Formation for the 21 st Century
 Faith Formation 2020 Envisioning Dynamic, Engaging and Inspiring Faith Formation for the 21 st Century John Roberto www.lifelongfaith.com u jroberto@lifelongfaith.com Part 1. Eight Significant Driving
The Global Religious Landscape
 The Global Religious Landscape A Report on the Size and Distribution of the World s Major Religious Groups as of 2010 ANALYSIS December 18, 2012 Executive Summary Navigate this page: Geographic Distribution
Focusing the It s Time Urban Mission Initiative
 63 CLYDE MORGAN Focusing the It s Time Urban Mission Initiative Following the Mission to the Cities emphasis during the current quinquennium from 2010-2015, the 2013 Annual Council of the Seventh-day Adventist
NATIONAL HOUSEHOLD SURVEY
 NATIONAL HOUSEHOLD SURVEY THE JEWISH COMMUNITY OF MONTREAL PART 1 BASIC DEMOGRAPHICS PART 2 JEWISH POPULATIONS IN GEOGRAPHIC AREAS BY CHARLES SHAHAR JUNE 2014 2011 National Household Survey Analysis The
B25 NSW/ACT SYNOD 2. LEADERSHIP AND SYNOD STANDING COMMITTEE (SSC) COMPOSITION
 COMPOSITION") 1. OVERVIEW AND CONTEXT B25 NSW/ACT SYNOD The NSW/ACT Synod covers approximately 811,802 km² supporting 13 Presbyteries and more than 400 Congregations, Faith Communities and Parish Missions. There are
1. OVERVIEW AND CONTEXT B25 NSW/ACT SYNOD The NSW/ACT Synod covers approximately 811,802 km² supporting 13 Presbyteries and more than 400 Congregations, Faith Communities and Parish Missions. There are
Bulletin Articles on 20/20 Plan By Fr. Peter Berger
 Bulletin Articles on 20/20 Plan By Fr. Peter Berger Article I I wanted to take some time over the next few bulletins to bring you up to speed on the Archdiocesan Planning Process which has been underway
Comprehensive Plan for the Formation of Catechetical Leaders for the Third Millennium
 Comprehensive Plan for the Formation of Catechetical Leaders for the Third Millennium The Comprehensive Plan for the Formation of Catechetical Leaders for the Third Millennium is developed in four sections.
2008 SURVEY OF NAECED MEMBERS
 2008 SURVEY OF NAECED MEMBERS Foreword: With approval of other board members of NAECED and the affirmation of PEALL (Proclaiming Education for All), Sharon Pearson spearheaded this survey of the NAECED
Religious Life in England and Wales
 Religious Life in England and Wales Executive Report 1 study commissioned by the Compass Project Compass is sponsored by a group of Roman Catholic Religious Orders and Congregations. Introduction In recent
4D E F 58.07
 A Statistical Overview of the Grand Canyon Synod With comparisons to Rocky Mountain, Northern Texas Northern Louisiana, Southwestern Texas, and Texas Louisiana Gulf Coast Synods Research and Evaluation,
CHA Survey Gauges Formation Effectiveness
 PRELIMINARY RESULTS CHA Survey Gauges Formation Effectiveness By BRIAN P. SMITH, MS, MA, MDiv and SR. PATRICIA TALONE, RSM, PhD During the past 30 years, Catholic health care has transitioned from being
The Scripture Engagement of Students at Christian Colleges
 The 2013 Christian Life Survey The Scripture Engagement of Students at Christian Colleges The Center for Scripture Engagement at Taylor University HTTP://TUCSE.Taylor.Edu In 2013, the Center for Scripture
for E XCELLENCE Evaluation Worksheets Your Snapshots The Kingdom Perspective
 The Kingdom Perspective Look through the kingdom lens. What do you see in your church and Sunday School ministry to give evidence that the focus truly is on the kingdom of God and not the kingdom of self,
Generous giving to parish ministry will enable God s church to grow and flourish, now and in the future
 Contents Page The Common Mission Fund 3 Data Confirmation Process 4 How are Common Mission Fund requests calculated? 5 > Calculating your Worshipping Community 5 > Larger Worshipping Communities 5 > Understanding
EXECUTIVE SUMMARY. The mandate for the study was to:
 EXECUTIVE SUMMARY The study of sexual abuse of minors by Catholic priests and deacons resulting in this report was authorized and paid for by the United States Conference of Catholic Bishops (USCCB) pursuant
Wave 1a Panel Survey. Cohort Update 2018
 Wave 1a Panel Survey Cohort Update 2018 September 2018 1 The Living Ministry Research Project Background The work of the Church of England s Ministry Council, Renewing Discipleship and Ministry, included